


ChaosSearch and Grafana for Cloud-Native Observability
Unify your data, not your database

![]()
Best-of-breed approach
Use ChaosSearch to analyze log and event data — right in Grafana’s single pane of glass.
![]()
Analytics without retention limits
Break free from Loki’s metadata indexing limitations and scale issues.
![]()
Cloud-native observability
Scale your observability for microservices architectures at a fraction of the cost.
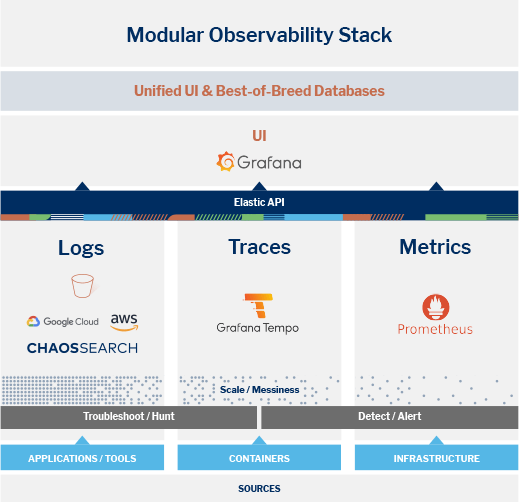
Cloud-native observability at scale – without the costs
Reduce the cost of your observability solution by leveraging a modular observability stack with native Open Telemetry support. Use Grafana as your UI across logs, metrics, and traces — integrating ChaosSearch as the backend for your logs via the ElasticSearch API. For added flexibility, use OpenSearch Dashboards and Superset (SQL) in the Chaos UI.


Break free from Loki's limitations
Metadata indexing didn’t meet your needs? Run into trouble scaling Loki? Need more than 30 days’ retention for your application logs? Break free from Loki’s limitations, and analyze log and event data via Elasticsearch API — seamlessly integrated with Grafana. Tap into a truly managed service with the durability of your cloud storage and unlimited hot retention, at a fraction of the cost.

A single source of truth for application telemetry
With the rise of microservices, service-focused teams, and DevOps, it’s critical to create a centralized data repository as a single source of truth for telemetry. Access product data across teams, improving the developer experience and SRE productivity. With SQL access, data scientists and analysts can explore product data in the same system.


Make the leap from typical observability to business observability
Application telemetry isn’t just for troubleshooting. It contains key product insights to drive business growth. Ingest live data flexibly in real-time and analyze it via SQL with native join support, so you can build the next key feature, monetize power users, and target new audiences.

Ready to get more from your logs?
