

Calculating log analytics ROI is often complicated. For many teams, this technology can be a cost center. Depending on your platform, the cost of a log management solution can quickly add up. For example, many organizations use solutions like the ELK stack because the initial startup costs are low. Yet, over time, costs can creep up for many reasons, including the volume of data collected and ingested per day, required retention periods, and the associated personnel needed to manage the deployment.

Instead of viewing log management as a cost center, it’s more valuable to look at its business value and impact on your bottom line. Calculating log analytics ROI involves two main steps:
- Determining the value of log analytics to your organization
- Figuring out the total cost of ownership (TCO) of your log analytics solution

Luckily, there are options for log analytics solutions that can both lower costs and provide a clearer path to ROI. Let’s learn more.
The business case for log analysis
Log data contains insights that your organization needs to run more effectively and securely. By analyzing log data, you can get details about the entire IT environment in real time, or at any point in time in history.
For example, server logs can be used to monitor the health and security status of the IT landscape, because they contain details on:
- Machine and network traffic
- User access
- Changes to applications and services
- And countless other indicators.
Using this information, organizations can meet a variety of business objectives. Here’s how.
Leveraging valuable insights from trends in your log files
There are many unique use cases for log data. For example, most teams use log analytics for security and compliance purposes. Using the same tools for IT and security operations can save organizations time and money. Perhaps more importantly, log analysis can reduce the risk of a security breach.
Using this technology, organizations can identify potential security threats faster. By integrating log analytics with a security information and events management (SIEM) system, DevSecOps teams can act quickly on alerts and identify the root cause of malicious activity within their infrastructure and applications. Other teams may choose to integrate an XDR with log analytics (extended detection and response) to enhance their cybersecurity posture. By correlating security data from multiple sources (including log data), XDR solutions can identify threats that may have been missed by traditional security tools and provide a more complete picture of the attack lifecycle.
What’s more, many compliance regulations, such as SOC 2, PCI, and GDPR, require that you retain your logs for a set period of time. For this reason, using a cost-efficient log analysis tool can lower the cost of long-term long retention and help you meet compliance requirements.
Many organizations also use log analytics to troubleshoot cloud infrastructure and IT issues. This data can reveal critical insights on recurring patterns in your cloud environment, which you can leverage to optimize cloud performance, security, and more. Often, detecting ongoing cloud issues requires more than in-the-moment data available via monitoring and observability platforms. Beyond cloud infrastructure, a log analytics platform can help CloudOps teams monitor everything – including apps, servers, load balancers and devices.

Finally, business users can leverage structured query language (SQL) to search log data, making smarter business decisions. Using common business intelligence (BI) tools such as Tableau or Looker, any user on the team can leverage analytics to influence key business decisions – such as prioritizing product pipelines, improving the customer experience, and more.
Mapping business benefits to cost centers
Some of these benefits above can be mapped to clear cost centers. In many cases, the cost of inaction is clear. For example, the average cost of a data breach in 2023 was $4.45 million, a 2.3% increase over 2022’s cost of $4.35 million. With the variety and number of security incidents increasing, it’s likely this number will continue to rise.
In addition, depending on your industry, the cost of non-compliance can be severe. Violations to widely applicable data protection laws like GDPR can cost organizations hundreds of thousands to millions of dollars.
Beyond security and compliance, unchecked cloud costs can add up. Many of these costs are due to solvable problems that can be identified with the right log analytics solution. During the pandemic, many organizations scaled their cloud consumption, with little to no insight into how this added scale would impact their bottom line.
The high cost of observability solutions
Many teams leverage an all-in-one observability solution to track their cloud environments. However, as applications are decomposed into microservices and deployed across dynamic and scalable cloud environments, the ability to gain insights into the system's behavior becomes increasingly challenging. This fact, along with the continuous growth in application usage, has led to an exponential increase in the volume of application telemetry generated.
The increase in infrastructure complexity requires a centralized repository of all telemetry for monitoring and troubleshooting. But, the exponential increase in data growth and need for data retention lead to ballooning costs. Here are a few examples.
- Datadog: Datadog monitoring costs add up quickly, when it comes to log management workflows. That’s because the log analytics process within Datadog is way more complex than it needs to be. In addition, there’s a separate pricing structure around ingestion and retention. Because of the complexity and cost structure, some organizations choose not to retain as many logs. Many teams also experience scaling challenges, including a loss of visibility into long-term data.
- Elasticsearch: ELK logging can get costly and complicated fast. Configuring and managing the ELK stack only gets more complex and time-consuming as deployments scale, requiring additional hours from DevOps teams to ensure optimal performance and value creation when using the ELK stack for log analytics and management.
- Splunk: Splunk is a popular SIEM choice for security observability, yet retention costs for analyzing log and event data add up. However, augmenting Splunk with log analytics tools built on top of Amazon S3 can significantly increase visibility of long-term log data, while taking advantage of low-cost cloud object storage.
- CloudWatch: Log analytics with CloudWatch, similar to Datadog, can be costly and impose limitations on data retention. Plus, it only supports AWS. In addition, CloudWatch lacks the data integration depth and correlation features necessary to recognize very complex patterns or perform root-cause analysis across larger and multiple data sources.

Log analytics ROI: hidden benefits
Some other business benefits of log analysis are less tangible. For example, unlocking insights from log analytics via BI can help teams:
- Ship software and respond to issues faster
- Identify additional revenue opportunities
- Get improved product intelligence
- Identify reasons for churn in the customer experience
Making these important business improvements can make a real difference to your organization’s bottom line.
How to calculate log management costs
Now that we’ve covered some of the key business benefits, it’s time to look at how to calculate the TCO of log analytics. To do that, consider how the following aspects of log monitoring and retention will impact your monthly cost. Here are some key questions to ask:
- Data retention: How many days do you need to retain logs to meet compliance or business requirements, before moving these logs to cold storage?
- Ingestion rate: How much raw data will you need to ingest per day?
- Overhead: How will your storage capacity account for sudden spikes in data ingestion, due to unexpected events such as legitimate user demands or unauthorized activity?
From there, you should consider the cost of inaction (see the cost centers identified above) within your TCO calculation. In other words, how much will not having a log analytics solution cost you?
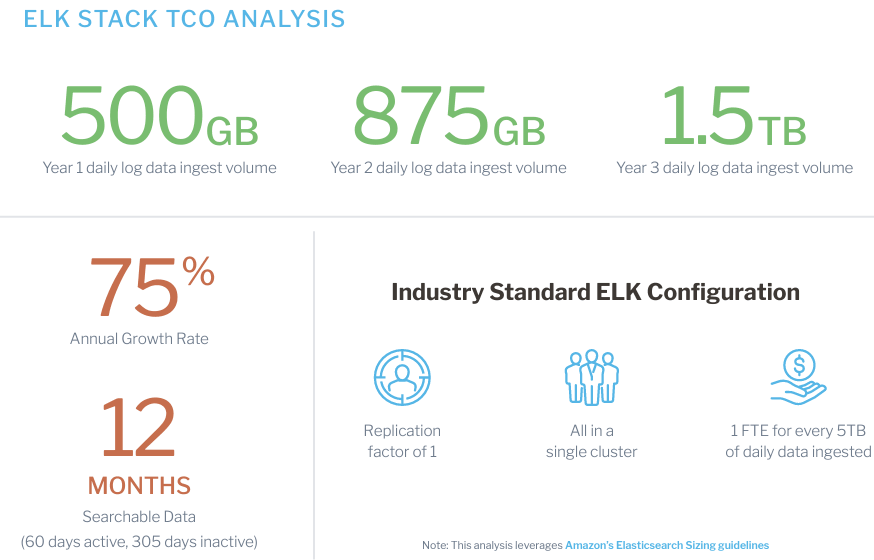
Calculate log costs with the ELK Stack and compare it against your organization’s growth requirements.
Beyond the hard numbers, be sure to map the intangible benefits – including the potential to drive bottom line revenue by discovering previously unidentified insights. One other aspect to think about is how log analytics can complement existing observability investments, such as a security information and event management (SIEM) platform or an observability tool.
If you are using a costly log analytics solution, such as the ELK stack, it might be time to consider a more cost-efficient alternative. A true TCO analysis of your ELK stack must include the cost of administration and maintenance, as well as difficult trade-offs for data retention. Fortunately, the unique ChaosSearch architecture and technologies consume far fewer resources than a comparable ELK stack, providing cost savings of up to 80%.
Learn how ELK stack costs are generated and can quickly mount, including: deploying your infrastructure, managing ongoing operations, scaling the stack and more.


