

The open-source Kubernetes platform has become the de facto standard for deploying, managing, and scaling containerized services and workloads. In fact, 83% of DevOps teams are using Kubernetes to deploy containerized applications in production, taking advantage of its workload orchestration and automation capabilities to optimize the software development process and reduce web server provisioning costs.
While the benefits of container orchestration with Kubernetes are well-known in the DevOps community, software engineers and SysAdmins still face significant challenges throughout the process. One of those challenges is Kubernetes monitoring — the process of capturing log and event data from the Kubernetes cluster, pods, containers, physical or virtual host machines, and containerized applications.
In this week’s blog post, we’re taking a closer look at the challenges associated with Kubernetes monitoring, the key requirements for a comprehensive Kubernetes monitoring solution, and the most effective Kubernetes monitoring tools and technologies for high-performance DevOps teams.
How Does Kubernetes Monitoring Work?
Let’s start with a high-level overview of native Kubernetes monitoring capabilities and how DevOps teams can leverage them to start collecting application metrics and capturing log data from orchestrated container infrastructures.
7 Infrastructure Components for a Complete Kubernetes Monitoring Solution
- Kubernetes Cluster - Deploying a Kubernetes Cluster is the first step towards orchestrating containerized application workloads. A working Kubernetes cluster consists of two basic components: a master node that runs the Kubernetes control plane, and a collection of worker machines called nodes.
- Kubernetes Control Plane - Every Kubernetes Cluster contains at least one master node that runs the Kubernetes Control Plane. The control plane consists of several components that help manage the cluster’s overall state and orchestrate operations. These include:
- Kube-apiserver - A component that exposes the Kubernetes API.
- Kube-scheduler - A component that detects newly created pods and assigns them to a node. Node assignments are based on the number of pods on existing nodes and availability of node/cluster resources.
- Kube-controller-manager - A component that watches the state of the cluster and tries to maintain the user’s desired configuration.
- Cloud-controller-manager - A component that allows the user to embed cloud-specific control logic.
- Etcd - A component that provides backing storage for Kubernetes cluster data.
- Kubernetes Nodes - Kubernetes nodes are the worker machines that handle containerized application workloads.

Image SourceBasic Kubernetes cluster architecture with control plane and three worker nodes.
- Kubernetes Pods - Each Kubernetes node in the cluster runs one or more Kubernetes pods. A pod is a group of containers with shared storage, network resources, network namespace, IPC namespace, and operational specifications.
- Containers - A container is an executable piece of software that includes an application and all of its related configuration files, libraries, and dependencies. Pods can contain more than one container if their functions are tightly coupled.
- Containerized Applications - Containerized applications are executable software programs that have been packaged in containers along with their related dependencies.
- Host Machines - Kubernetes can run on bare metal servers, virtual machines, on-prem services, or in the public cloud.
Monitoring a Kubernetes Cluster with containerized applications and an orchestration layer is more complex and significantly different from monitoring traditional application infrastructures which consist exclusively of host machines and the applications running on them.
.png?width=720&height=351&name=Infrastructure%20models%20and%20components%20to%20monitor%20(1).png)
This graphic depicts the growing number of components that DevOps teams must monitor as they transition from traditional to orchestrated containerized infrastructure models.
Image Source: Datadog HQ
When it comes to monitoring Kubernetes infrastructure, DevOps teams can utilize two types of information: metrics and logs.
What to Track? Kubernetes Monitoring with Metrics
There are two types of Kubernetes monitoring metrics that DevOps teams can track: resource utilization metrics, and service metrics.
Resource metrics include information about Kubernetes resource consumption and utilization, including CPU and memory usage, filesystem space, and network traffic that can be queried for individual containers, pods, or the entire cluster using the Kubernetes Metrics API and command line. The main prerequisite for this type of Kubernetes monitoring is installing the Metrics Server onto your cluster.
Service metrics include metrics produced by Kubernetes infrastructure components, as well as those produced by containerized applications. DevOps teams can monitor service metrics by deploying the kube-state-metrics add-on into the Kubernetes cluster. Kube-state-metrics collects information by listening to the Kubernetes API and generates over 1,000 different metrics that reveal the state of Kubernetes objects, including status and capacity metrics for containers, nodes, pods, and replicas in the deployment.
The Kubernetes platform also defines a custom metrics API that can be implemented using a third-party solution like the Prometheus Adapter to collect metrics from a Prometheus server and expose them using Kubernetes API aggregation.
The ability to expose metrics with the Metrics Server and kube-state-metrics add-on allows DevOps engineers to monitor the status and resource consumption/allocation of their Kubernetes deployments at the cluster, pod, and container levels.

Capture System Component Logs with Kubernetes Monitoring
In addition to monitoring the Kubernetes deployment with metrics, DevOps engineers may also want to capture log and event data from both containerized applications and other Kubernetes components.
DevOps teams can capture system component logs from both containerized (e.g. Kubernetes scheduler and kube-proxy) and non-containerized (container runtime and the kubelet) Kubernetes components. Log messages are generated using the klog logging library and written to log files in the /var/log directory on the host machine.
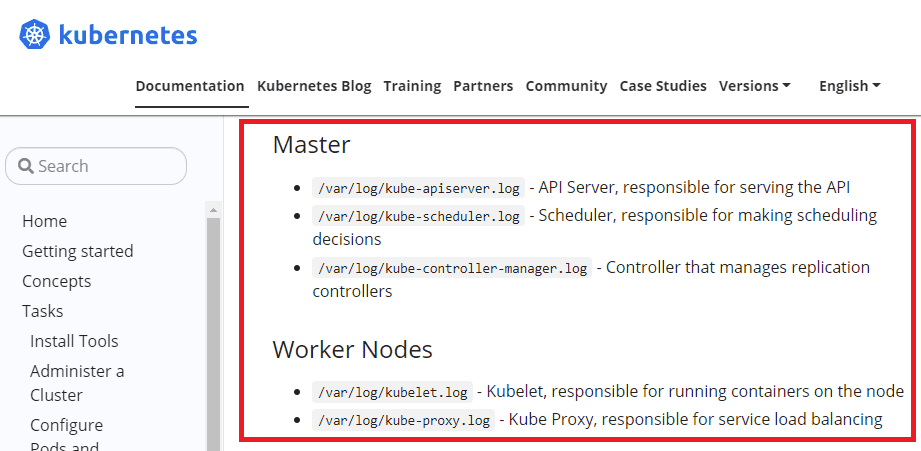
The available Kubernetes documentation highlights default storage locations for Kubernetes component logs.
Image Source: Kubernetes Documentation
The simplest solution for application logging in Kubernetes is to write logs to standard output (stdout) and standard error (stderr) streams, a function supported by most container engines (Google Container Engine, Docker, etc.).
As these logs are created, the Kubernetes note agent (known as the kubelet) writes them into a separate file that can be accessed by the user. If you’re using Docker, the default json-file logging driver automatically captures logs from these two streams and writes them to a log file in JSON format, which is then stored on the host machine/node. This process is known as node-level logging.
In node-level logging, logs are written to the stdout and stderr output streams. When log rotation is configured, the kubelet will rotate container logs and manage the logging directory structure. This helps manage log file sizes and ensure efficient use of disk space.
Additional logging drivers are also supported by Docker that power the extraction and shipping of important information from running containers and services to applications like Fluentd, Splunk, or Amazon CloudWatch Logs.
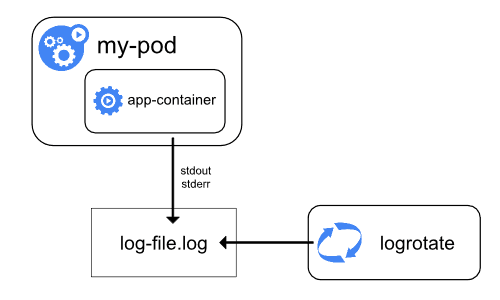
Kubernetes does not provide a native solution for cluster-level logging, but there are several approaches available for DevOps teams who wish to configure logging at the cluster level. The first option is to use a node-level logging agent that runs on every node in the Kubernetes cluster.
Kubernetes cluster-level monitoring with a node logging agent.
In this configuration, each node is equipped with a node-level logging agent that exposes or pushes logs to a backend logging system, such as Elasticsearch, Splunk, or even cloud object storage.
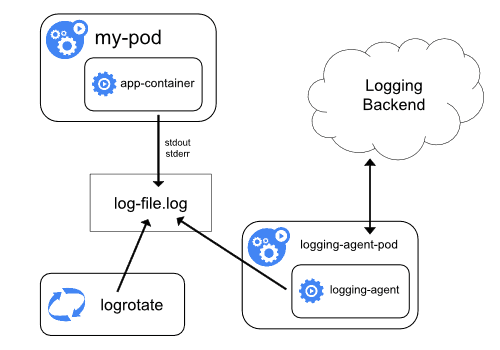
Another option for cluster-level logging utilizes a sidecar container that runs a logging agent (e.g. Fluentd). In this architecture, the logging agent is configured to pick up logs from a containerized application running in the same pod and push those logs to an external logging backend or repository like Amazon S3. This solution is fairly popular, but it does have drawbacks that include increased pod resource consumption and the inability to access these application logs via the Kubernetes command line.
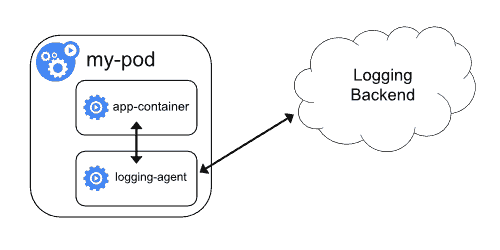
A Kubernetes logging architecture featuring a sidecar container that runs a logging agent, captures logs from a containerized app in the same pod, and pushes those log files to a logging backend.
Image Source: Kubernetes

Why is Kubernetes Monitoring a Challenge for DevOps Teams?
As we’ve already mentioned, a comprehensive Kubernetes monitoring program requires DevOps teams to capture and store log data from host machines, containerized applications, containers, Kubernetes pods, and the Kubernetes cluster itself.
The challenge for DevOps teams is that these requirements usually can’t be satisfied using the native functionality of a container engine, even when combined with the logging capabilities of the Kubernetes platform.
Below, we identify two major gaps in Kubernetes monitoring coverage that emerge when DevOps teams attempt to rely on the native logging capabilities of container engines and the Kubernetes platform.
Challenge: Application Logs with Absent Metadata
Log data from containerized applications is usually written to standard output (stdout) and standard error (stderr) streams, which end up stored locally on the host machine/node.
These log files will include application metadata, but they’re stored without important Kubernetes metadata that could help DevOps teams diagnose application issues caused by problems with the Kubernetes deployment or configuration.
Challenge: Deleted Application Logs
A significant issue that appears when utilizing node-level logging in Kubernetes is the instability of log data generated by containerized applications.
When an application crashes on a traditional virtual machine, log data remains available for review by DevOps teams. However, this is not the case when we’re doing node-level logging. When a Kubernetes pod (a group of containers with shared storage, network resources, and operational specs) terminates, or moves to a different node, logs from the containerized applications are permanently deleted.
This makes it impossible for DevOps teams to review those logs and understand why the crash occurred in the first place!
To get around this issue, DevOps teams need to set up cluster-level logging, which requires a separate system for storing and analyzing log files from containerized applications.
Cluster-level logging is not supported natively by the Kubernetes platform or the most popular container engines (e.g. Docker hub) - it relies on log drivers to push log/event data to third-party software solutions that provide the storage back-end and analysis/querying capabilities.
Let’s now take a closer look at some of the tools and technologies that DevOps teams can use to plug the holes in their Kubernetes monitoring programs.

3 Kubernetes Monitoring Solutions You Should Know
Implementing cluster-level logging is the best way to shore up your Kubernetes monitoring program and ensure you’re getting access to robust data without any risk of losing vital application logs. With that in mind, here are some of the most important software tools that DevOps teams are using to implement cluster-level logging and enhance their Kubernetes monitoring strategies.
1. cAdvisor + Prometheus + Grafana
Container Advisor (cAdvisor) is a Kubernetes monitoring tool that exposes data from running containers, including resource usage and performance metrics.
Prometheus was the second addition to the Cloud Native Computing Foundation after Kubernetes. This tool provides event monitoring and alerting capabilities for the Kubernetes deployment, including data storage in the form of metrics, time series data collection, alerts, monitoring, and querying.
With cAdvisor + Prometheus, DevOps teams can scrape container metrics using cAdvisor, store and query the data in time-series using Prometheus, then use Grafana to build visualizations and dashboards that drive insight development.
2. EFK/ELK Stack
Another common solution for Kubernetes logging is the open-source ELK/EFK stack of Elasticsearch, Logstash/Fluentd, and Kibana.
The ELK stack uses Logstash to collect log data, Elasticsearch for back-end storage and querying of log data, and Kibana for visualization and dashboards.
DevOps teams may choose to utilize Fluentd instead of Logstash as a log aggregator tool for Kubernetes monitoring purposes. Fluentd is an efficient and highly scalable open-source data collector that deploys onto the Kubernetes cluster, captures log data from multiple nodes, and forwards that data to Elasticsearch for storage, indexing, querying, and eventually analysis and visualization in Kibana.
Despite being one of the most widely adopted solutions for Kubernetes monitoring, ELK/EFK stack does have its limitations. Elasticsearch deployments become increasingly complex and expensive with scaling log volume, which leads to predictable issues like ELK Stack performance degradation and data retention challenges.
READ: The Business Case for Switching from the ELK Stack
3. Fluentd/Logstash + ChaosSearch
ChaosSearch replaces your Elasticsearch cluster, combining with log shippers like Fluentd or Logstash to deliver a best-in-class solution for cluster-level logging with Kuberbetes. With Fluentd + ChaosSearch, DevOps teams can capture Kubernetes log data at scale to support log analytics use cases like application performance monitoring, security operations and threat hunting, and troubleshooting cloud services.
The architecture is simple: log data is generated by containerized applications, written to the stdout and stderr streams, and stored in a log file - just like in node-level logging. But those logs don’t just stay on the host node - instead, Fluentd acts as a logging agent that collects, parses, and pushes log files into your Amazon S3 buckets.
Once your logs are in Amazon S3, the ChaosSearch cloud data platform gives you the ability to:
- Fully index log data at scale with massive compression,
- Index log files live, in real-time, or configure batch indexing as needed,
- Clean, prepare, and transform log data with no data movement,
- Query log data using the Elasticsearch API, and
- Create data visualizations and dashboard with our customized version of the Kibana Open Distro.
ChaosSearch allows DevOps teams to achieve the true promise of data lake economics at scale while providing a comprehensive solution for monitoring Kubernetes cluster event logs with no data loss.
READ: How to Move Kubernetes Logs to S3 with Logstash
.png?width=1053&height=604&name=Kubernetes%20Logging%20Architecture%20with%20ChaosSearch%20(1).png)
This Kubernetes logging architecture uses Fluentd to extract and ship log data from containerized applications to Amazon S3 buckets. Once the data reaches Amazon S3, users can index, transform, query, and visualize log data using ChaosSearch.
Image Source: ChaosSearch
Getting Started with Kubernetes Monitoring
Kubernetes is continuing to grow in popularity in 2021, with organizations increasingly depending on the platform for its container orchestration capabilities.
While the Kubernetes platform does provide some native functionality for log and metrics monitoring, a comprehensive Kubernetes monitoring solution requires additional tools and technologies that enable cluster-level logging.
With ChaosSearch, organizations who love Kubernetes will be able to monitor and analyze their Kubernetes and containerized application logs at scale, identify production issues with rapid time-to-insights, reduce continuous monitoring costs, configure alerting for the Kubernetes environment, and much more.
Ready to learn more?
View our free on-demand Webinar Kubernetes Log Analysis Made Easy…with ChaosSearch to see how easily you can start cost-effectively analyzing Kubernetes logs at scale.

