

DevOps has become the dominant software development and deployment methodology over the past decade.
In Atlassian’s DevOps Trends Survey, over half of the respondents said that their organizations had a dedicated DevOps team and 99% of respondents indicated that DevOps had a positive impact on their organization. In addition to DevOps teams, many have implemented Platform Engineering as a discipline, or designing technology platforms as a foundation for developers to build and deploy applications.
Continuous monitoring (CM) tools are a critical component of the DevOps pipeline, providing automated capabilities that allow developers to effectively monitor applications, infrastructure, and network components in the production environment.
To help you implement a comprehensive CM strategy for your next software development project, we’ve put together a list of the most powerful pipeline monitoring software tools with continuous monitoring capabilities we’ve come across in our travels. Give us a shout if there are major ones we’ve missed or important details we’ve overlooked.
What is Continuous Monitoring in DevOps?
Continuous Monitoring is an automated process that leverages specialized software tools to empower DevOps teams with enhanced visibility of application performance, security threats, and compliance concerns, with improved risk management across the entire DevOps pipeline.
Observability, APM and application troubleshooting are often closely related to the concept of continuous monitoring. Many DevOps monitoring tools deliver features and functionality that cover three capabilities: observability, monitoring, and analysis.
- Observability - Making data from within the application available and accessible for monitoring and analysis.
- Monitoring - Collecting, aggregating, and displaying application data for consumption by DevOps teams.
- Analysis - Manually or automatically investigating application data to extract insights that support a variety of DevOps use cases.

How Do DevOps Tools Benefit Your Business?
In addition to enhanced visibility of the production environment, continuous monitoring helps DevOps teams with real-time data to initiate rapid responses to application issues, avoid unplanned outages that negatively impact the customer experience, and achieve strategic business objectives and performance targets.
Continuous monitoring DevOps capabilities may be further divided into three types.
Types of Continuous Monitoring
- Infrastructure Monitoring - Tools and processes for monitoring the data centers, networks, hardware, and software needed to deliver products and services.
- Application Monitoring - Tools and processes for monitoring the health and performance of released applications in a production environment.
- Network Monitoring - Tools and processes for monitoring network activity and components, such as servers, firewalls, routers, and switches, as well as detecting security threats across the network.
Taking it a step further, DevOps analytics can even help you build better products. The end goal is to invest in product data to inform software development and engineering decisions. Ultimately, this helps teams effectively design products for the end user, leading to increased customer satisfaction.
Now let’s take a look at 10 of the leading continuous monitoring software tools for DevOps teams and the capabilities they provide.
Our Roundup of the 10 DevOps Tools for Continuous Monitoring
Akamai mPulse
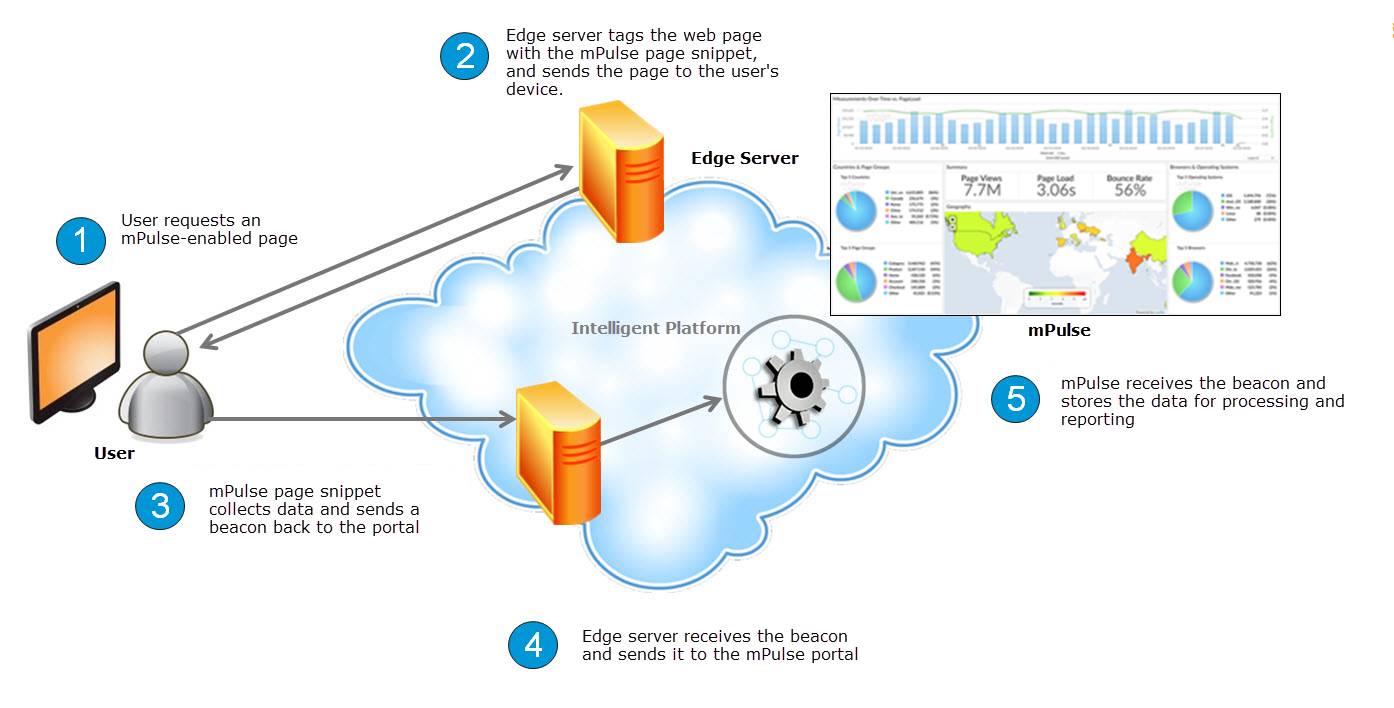
Image Source: Akamai
Overview: Akamai mPulse is a Real User Monitoring (RUM) tool that allows DevOps teams to collect and analyze experience and behavior data from users who visit their website or application.
Developers can capture over 200 business and performance facts from each user session simply by installing the mPulse snippet on the target web page or app. mPulse captures application performance and UX metrics, including session and user agent data, bandwidth and latency, loading times, and much more.
Use Cases: Application monitoring for websites and native applications via user behavior and user experience monitoring.
Pros:
- Ease of deployment
- RUM provides reliable performance data and feedback
- System dashboards offer real-time user activity insights
- DevOps teams can create and monitor custom metrics, or build custom dashboards to meet their needs
Cons:
- Narrow scope
- Complexity of creating customized metrics, dashboards, and alerts
- Outdated user interface
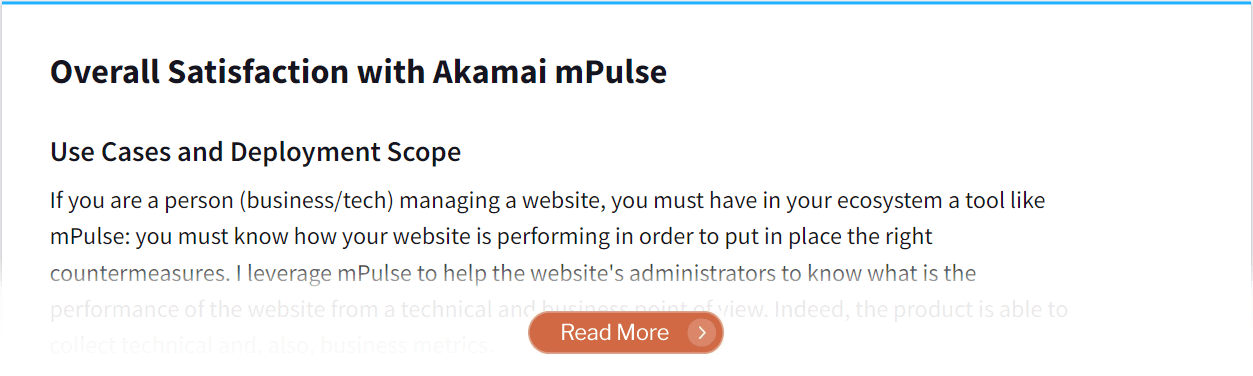
Comprehensive Akamai mPulse Review
AppDynamics
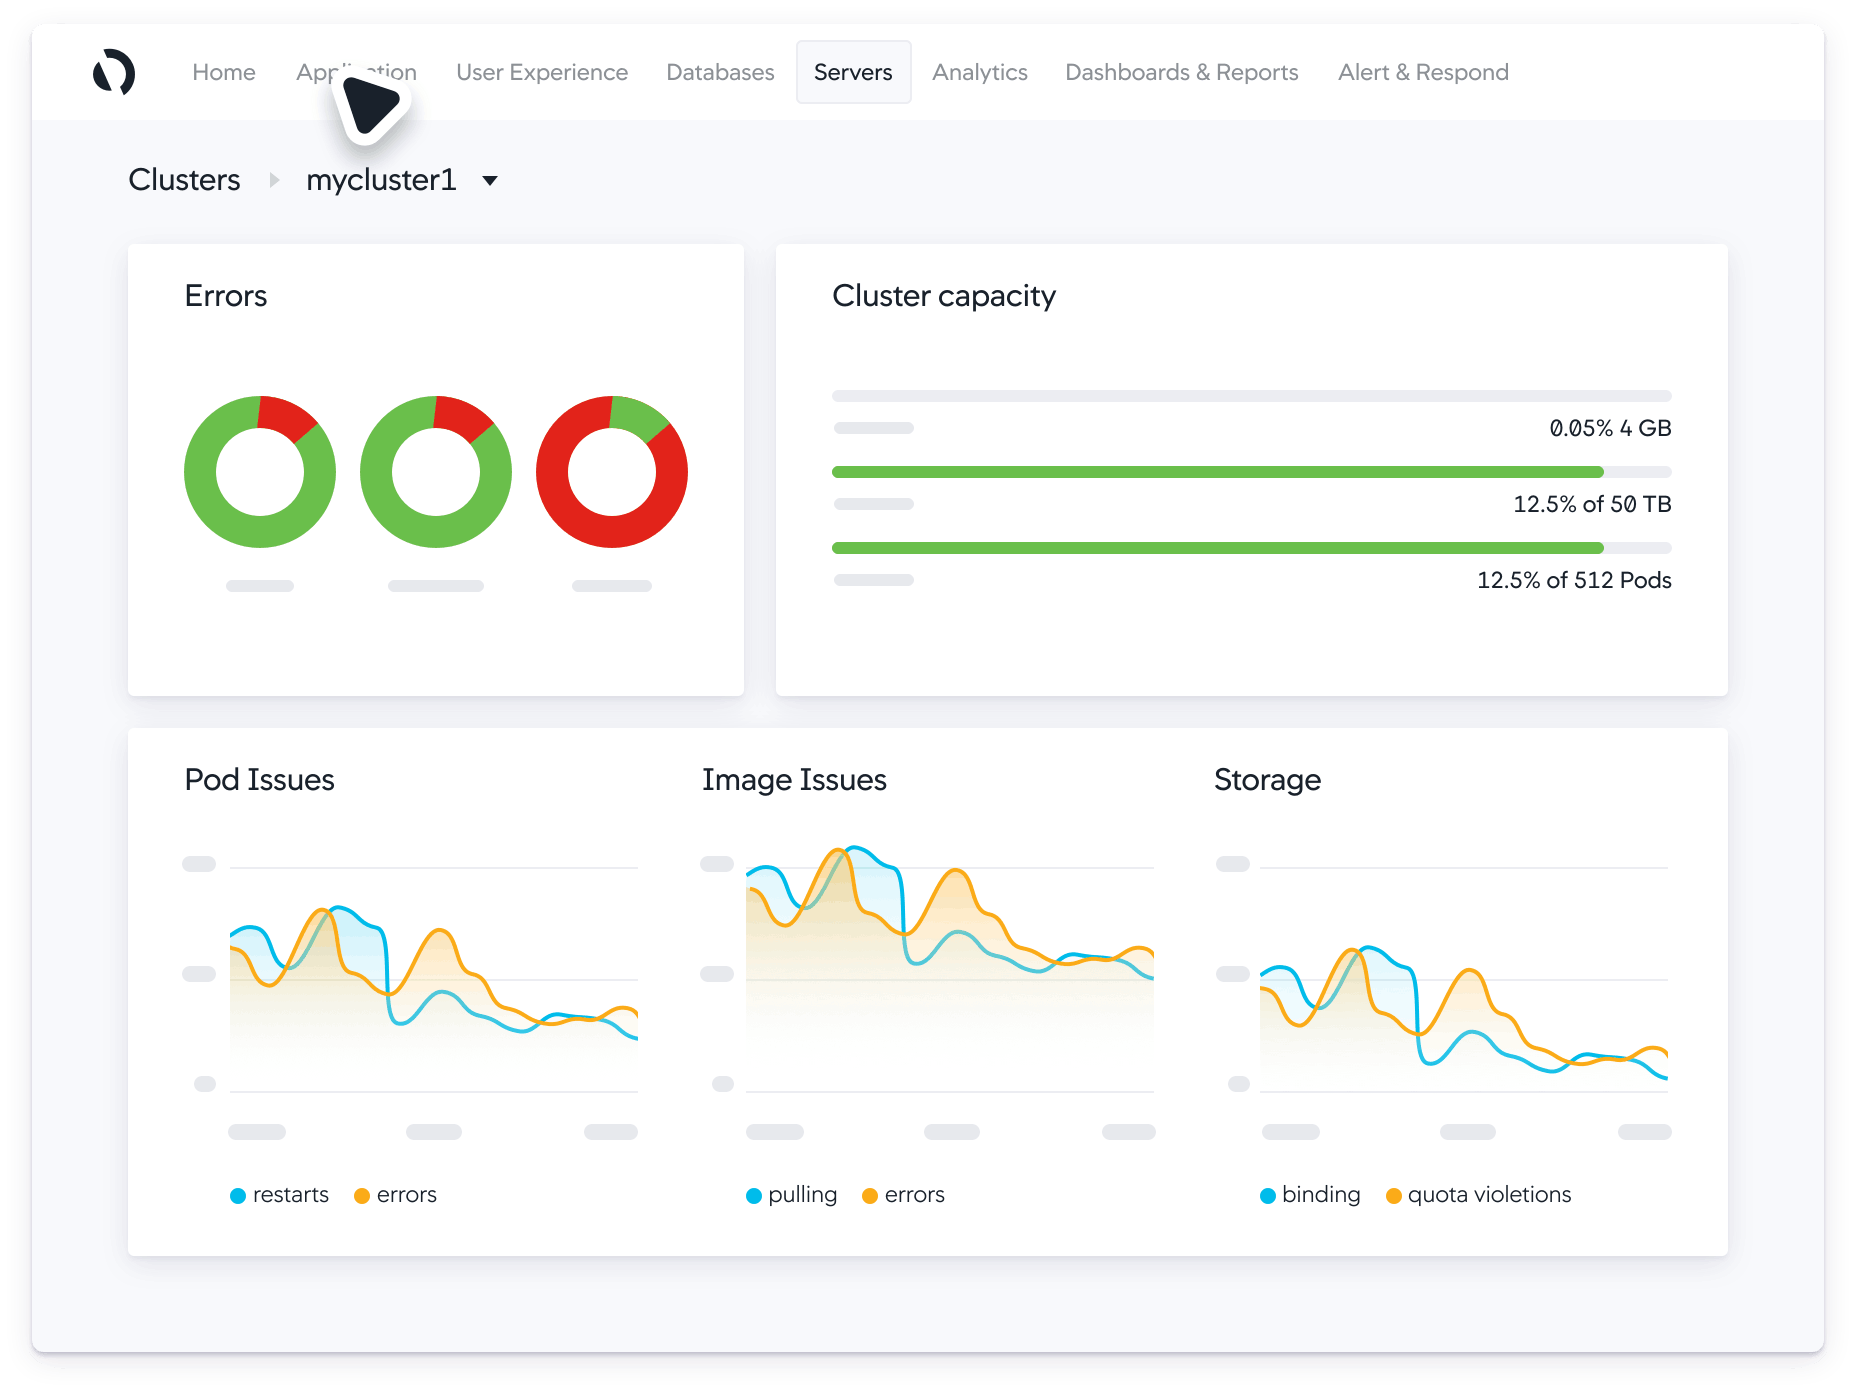
Image Source: AppDynamics
Overview: Acquired by Cisco for $3.7 billion in 2017, AppDynamics is a continuous monitoring tool that supports infrastructure, network, and application monitoring of both cloud and on-premises computing environments. DevOps teams can capture data from infrastructure components, database transactions, applications, end user sessions, and other sources to maintain full visibility into the tech stack and rapidly respond to performance issues before they negatively impact the customer experience.
Use Cases: On-prem and cloud infrastructure monitoring, network security monitoring, application performance monitoring.
Pros:
- Multi-platform support (AWS, Microsoft Azure, Docker, IBM, Kubernetes, and more)
- Instant root cause diagnostics driven by machine learning
- Hybrid environment monitoring
- Pay-per-use pricing model
Cons:
- Reports of SaaS platform instability and downtime
- High TCO due to enterprise pricing model
Critical AppDynamics Review
BMC Helix Operations Management
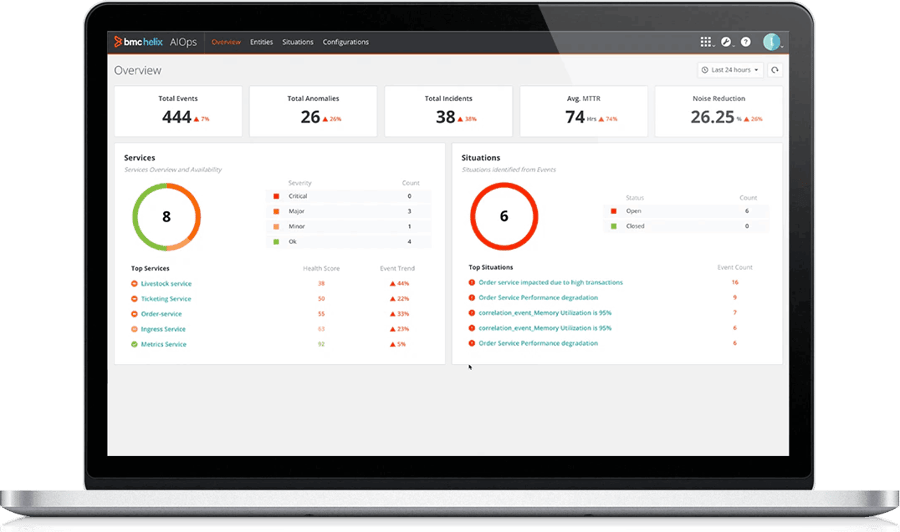
Image Source: BMC
Overview: BMC Helix Operations Management uses predictive analytics to effectively monitor the availability and performance of IT services across cloud, on-premises, and hybrid environments. The platform offers event monitoring, anomaly detection, and advanced event management - along with AI-driven proactive alerting capabilities and probable cause analysis that give DevOps teams a head start when responding to prospective events.
Use Cases: IT service monitoring, network event monitoring, intelligent anomaly detection, log analytics.
Pros:
- Ease of deployment with SaaS business model
- Predictive alerts with machine learning and advanced analytics
- Customizable dashboards and reports streamline data access
Cons:
- Time-consuming regular updates
- Complex set-up and configuration
ChaosSearch
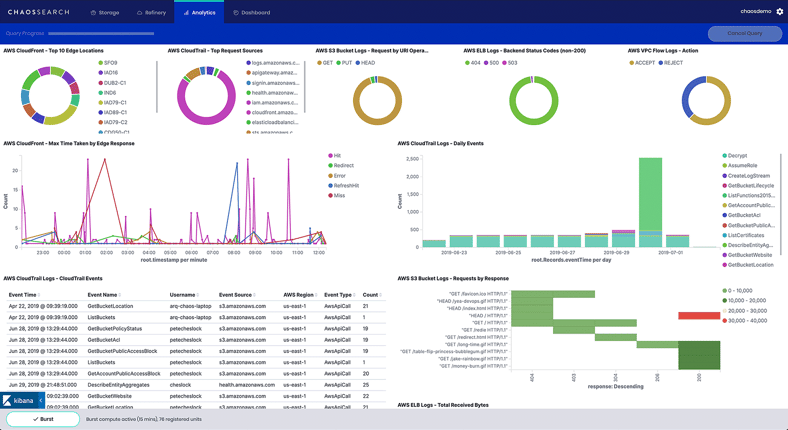
Image Source: ChaosSearch
Overview: ChaosSearch offers an innovative approach to continuous monitoring that combines robust data indexing and querying capabilities with data lake economics for a best-in-class log management solution. DevOps teams can ingest log and event data from all sources into Amazon S3 or Google Cloud Storage (GCS) buckets, index the data with proprietary technology, and rapidly achieve insights with no data movement or ETL process.
Building on its existing capabilities, ChaosSearch plans to deliver true multi-model data access by supporting full-text search, SQL, and machine learning queries against a single back-end data store.
Use Cases: Application monitoring, security and cloud log analysis, SQL analysis.
Pros:
- Proprietary data format/index offers significantly lower TCO when compared to alternatives
- Index, transform, and visualize data with no data movement and no ETL process, directly on cloud object storage at petabyte scale
- Supports full-text search and SQL queries, with ML support slated for release in 2023
Cons:
- Currently supports Amazon S3 and GCS as its storage backend, but plans to add Azure DevOps Monitoring tools along with other major public clouds in the future
- Not offered as an on-premises solution
Helpful ChaosSearch Review
Dynatrace
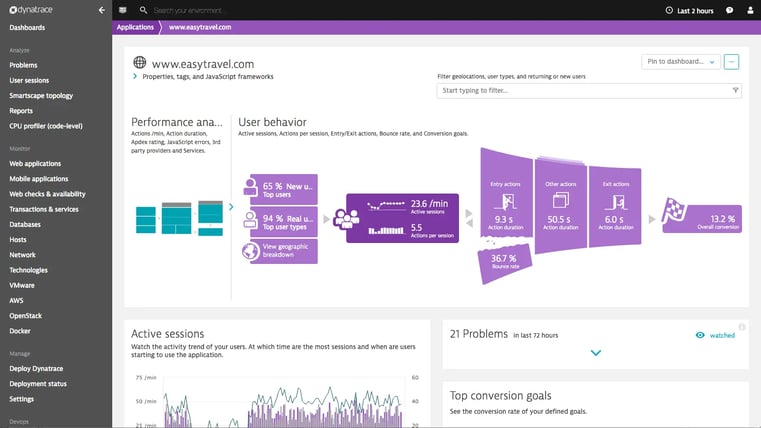
Image Source: Dynatrace
Overview: Dynatrace provides a single platform with the ability to monitor the entire DevOps environment and technology stack. DevOps teams can use Dynatrace to gain visibility into web and mobile applications, transactions and services, databases, hosts, and network infrastructure. The platform also supports monitoring of cloud-based platform-as-a-service and container technologies, including AWS, Azure, Google Cloud Platform, Kubernetes, Docker, and more.
Use Cases: Application and continuous monitoring in microservices, infrastructure monitoring, application security, cloud automation.
Pros:
- Monitor customized log metrics for extended observability
- All-in-one approach breaks down data silos in continuous monitoring
- Integration with ITSM tools to automate incident and event management workflows
Cons:
- High price point and cost optimization challenges
- Data retention limits create a need to extract and move data for long-term storage
- Complexity and steep learning curve
Elastic Observability
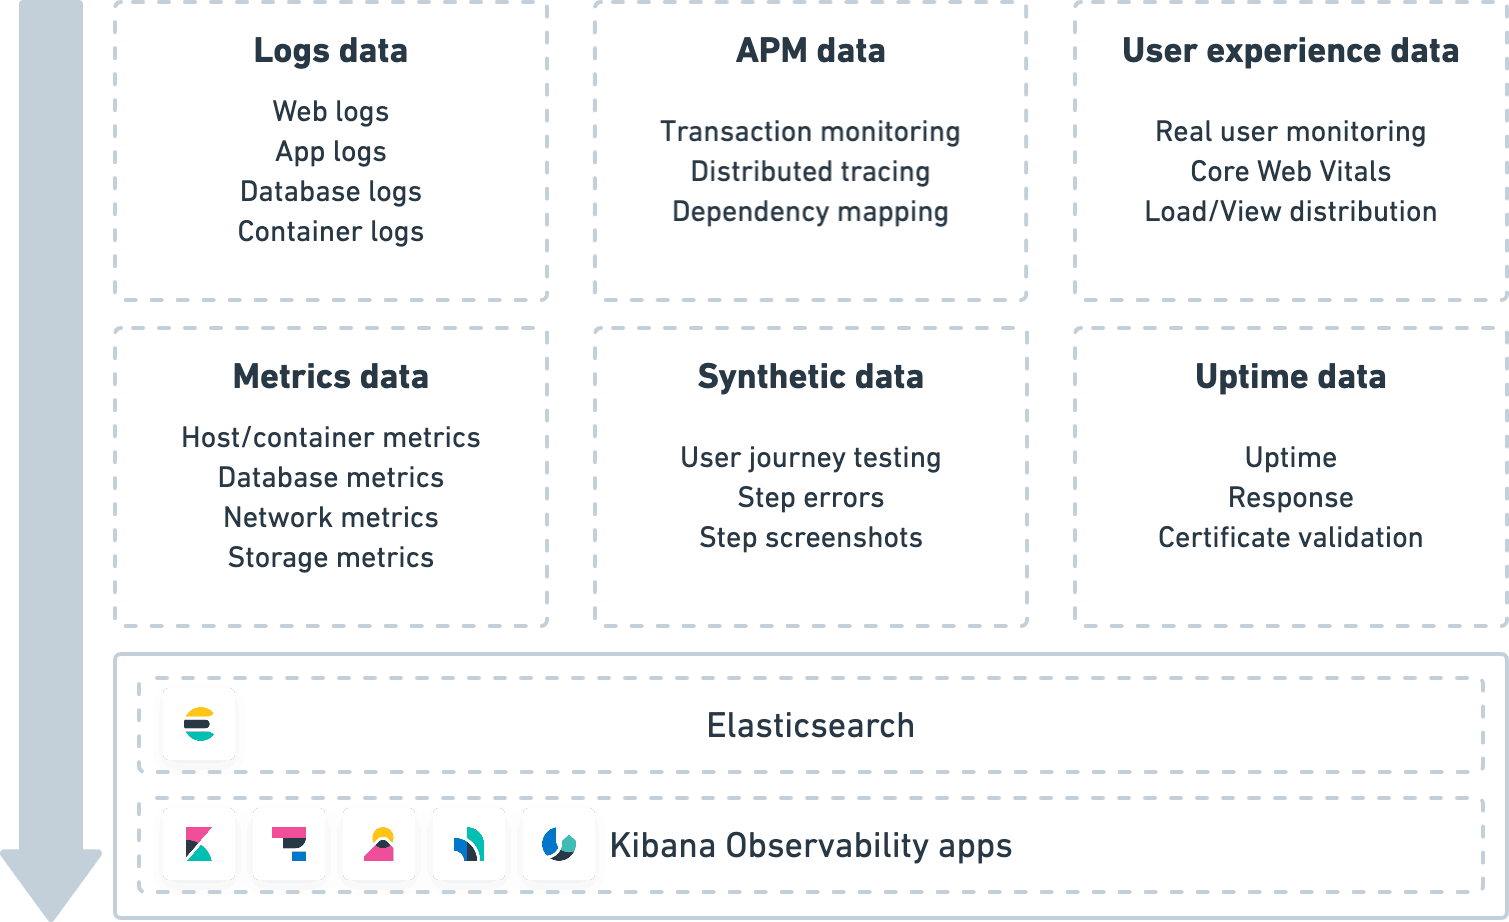
Image Source: Elastic
Overview: Elastic Observability is an open source tool that leverages the ELK (Elastic, Logstash, Kibana) Stack to combine logs and metrics, APM traces, uptime and UX data, and feedback from synthetic monitoring activities into a single solution that gives DevOps teams enhanced visibility of application performance in the production environment.
Use Cases: Application performance monitoring, real user monitoring, log analytics.
Pros:
- Pay-per-use pricing model
- Single unified platform for APM data
- ELK stack delivers log aggregation, indexing, and dashboarding/visualization capabilities
Cons:
- Known stability issues and performance degradation at scale
- Data retention limits create a need to extract data for long-term storage
- High resource utilization

New Relic One
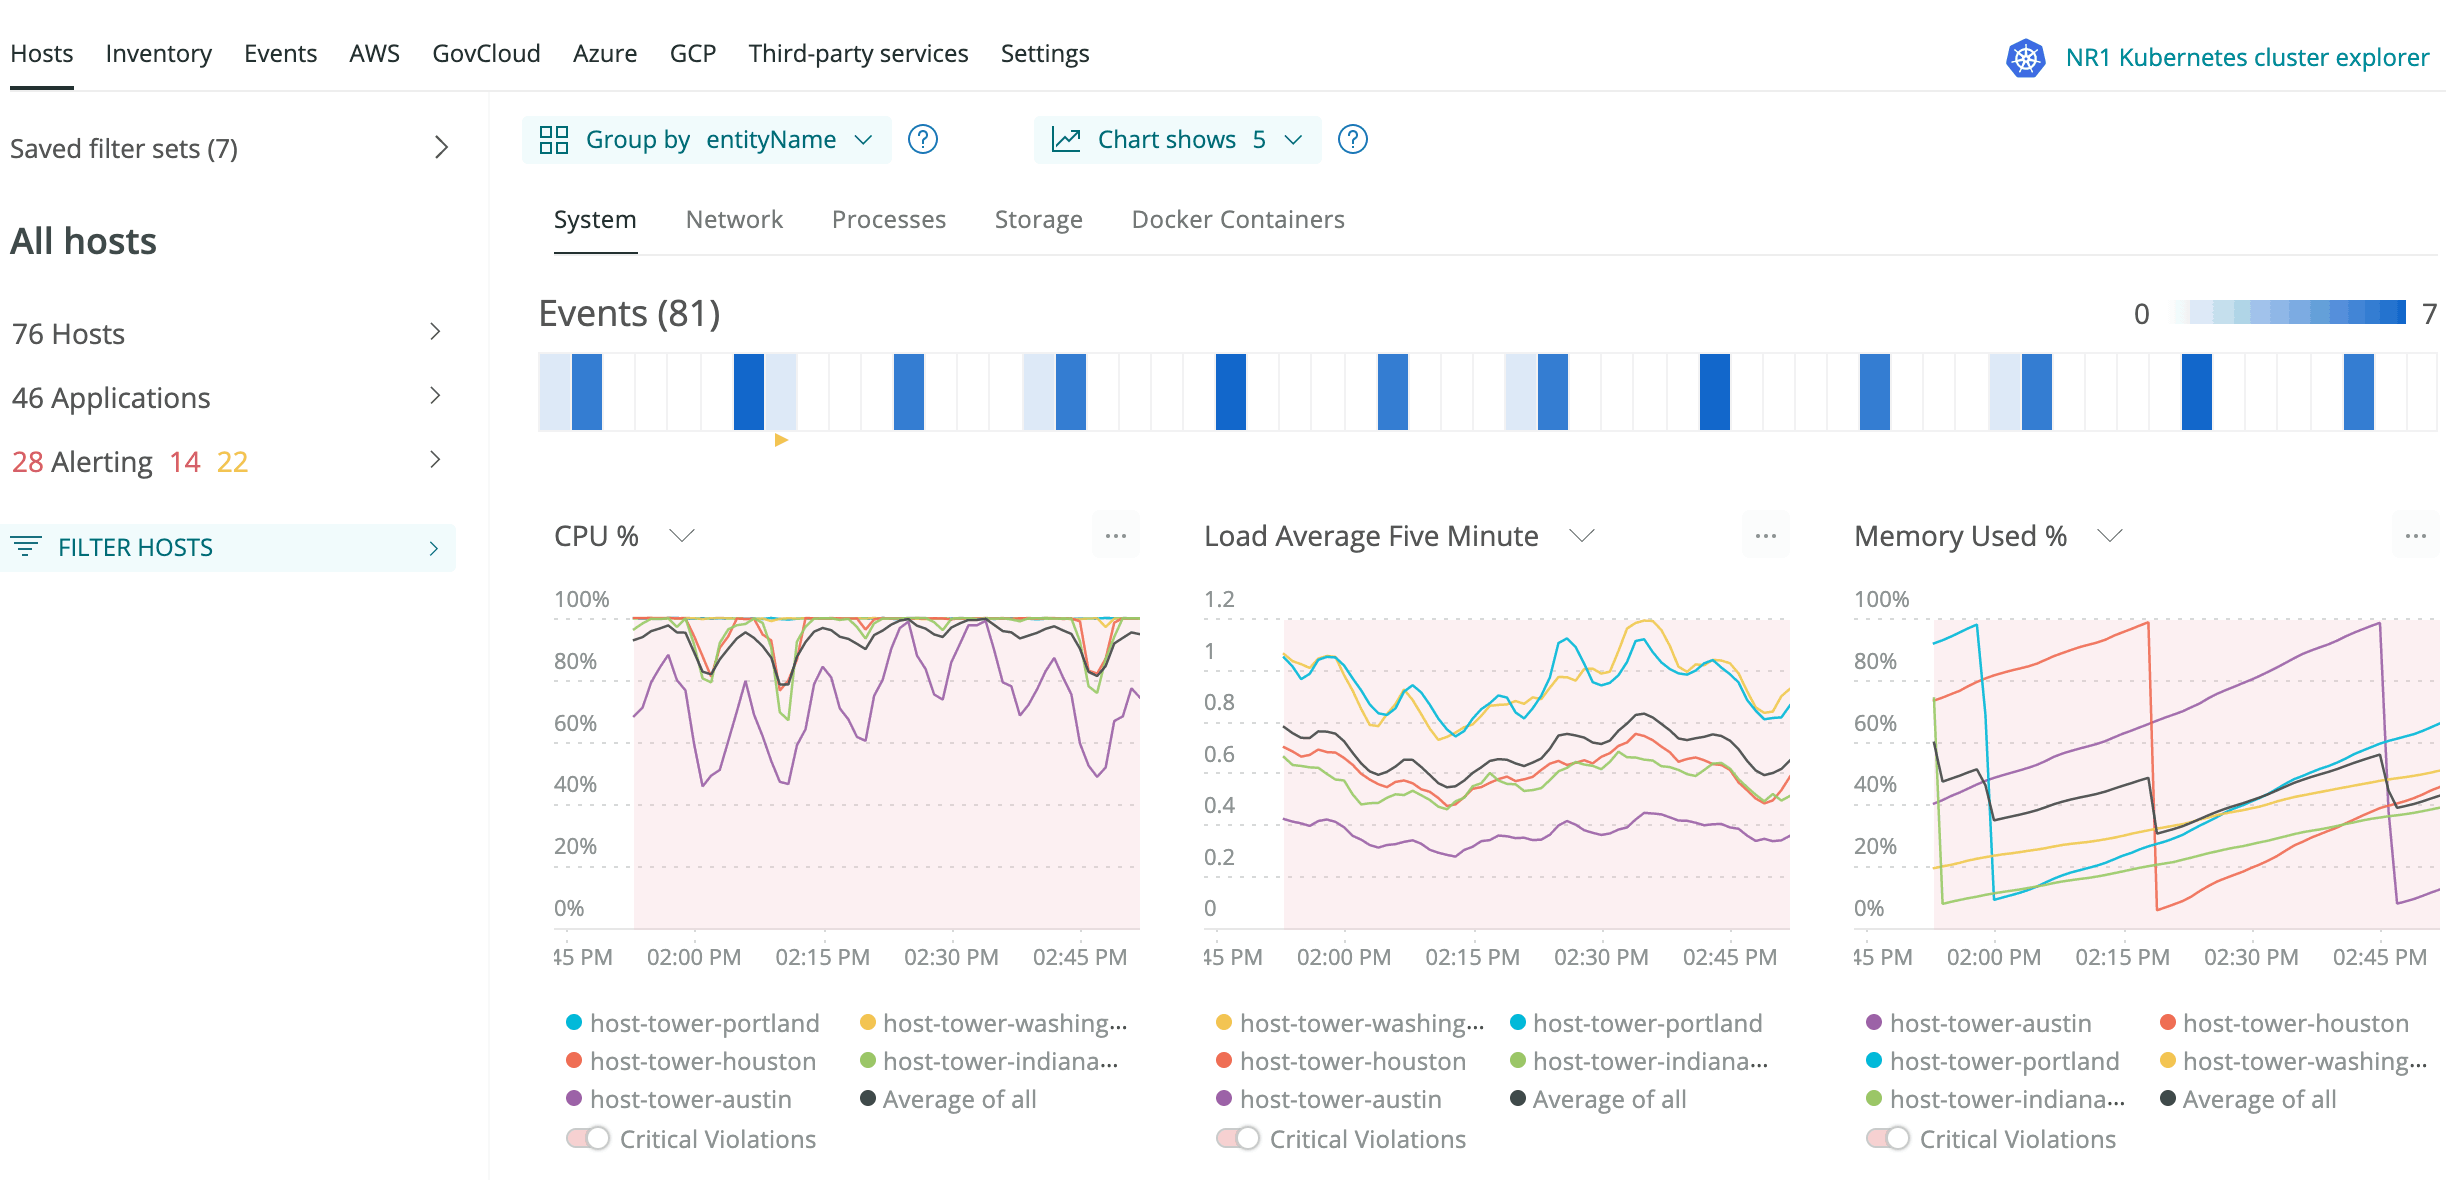
Image Source: New Relic
Overview: New Relic is another example of a continuous monitoring tool that delivers full observability of the entire software stack. DevOps teams benefit from a single platform that brings together four types of telemetry data: events, logs, metrics, and traces. Core features include browser and mobile session monitoring, visibility into servers, on-prem VMs, and cloud-native infrastructure, real user monitoring, and synthetic monitoring capabilities.
Use Cases: Application performance monitoring, infrastructure monitoring, serverless monitoring, digital experience monitoring.
Pros:
- 100 GB of free data ingest per month
- Pay-per-use pricing based on GB of data ingested
- Automatic correlation between logs, errors, and traces to accelerate root cause analysis
Cons:
- Code-level diagnostics not available for all programming languages
- Complex UI for new or occasional users
- Log search performance degradation at scale
Splunk
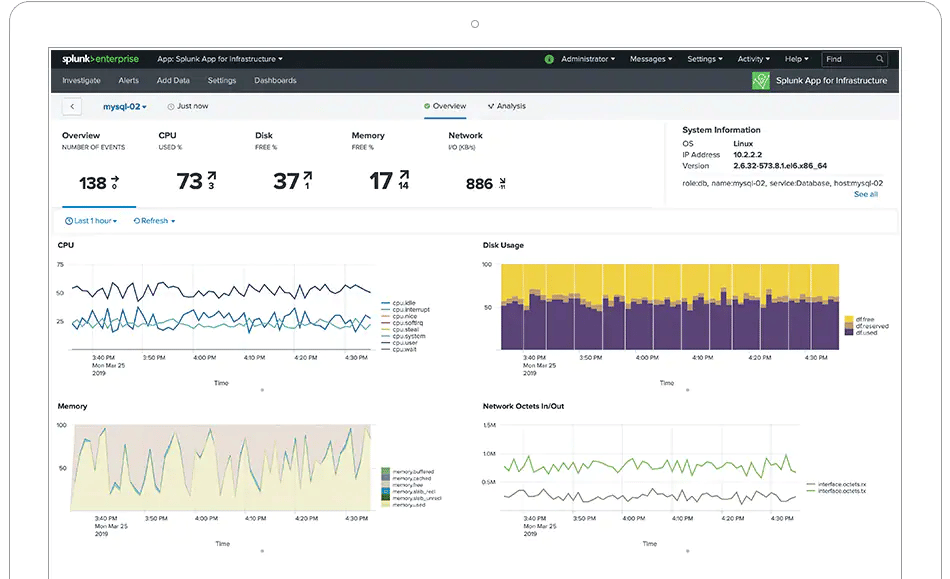
Image Source: Splunk
Overview: Splunk’s vision is to provide a single platform that empowers DevOps and IT teams to effectively monitor the entire enterprise application lifecycle. Splunk’s real-time monitoring features offer everything you’d expect from an observability platform that’s used by over 90% of Fortune 100 companies - infrastructure monitoring with auto-discovery, APM, log analysis across cloud native applications and environments, real user monitoring, and synthetic monitoring.
Splunk is expanding their offerings with the recent acquisition of SignalFX, a provider of real-time cloud monitoring and predictive analytics.
Use Cases: Service monitoring, infrastructure monitoring and troubleshooting, logs and event analytics, security information and event management.
Pros:
- Delivers real-time streaming analytics at scale
- Automated alerts with AI-driven analytics
- 50% of users reported faster time to market for new apps while using Splunk
Cons:
- Dedicated team and resources needed to manage installations, complex querying, and other requirements
- Complex architecture and high TCO
- Limited data retention period
Read more: Complement Splunk with a Security Data Lake
Sumo Logic
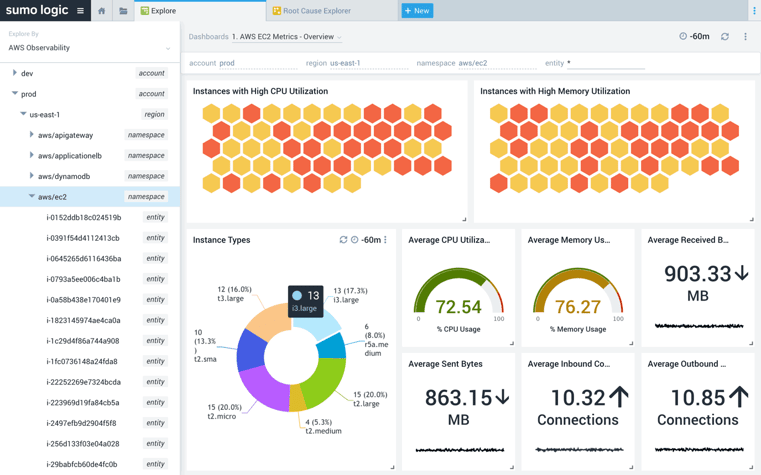
Image Source: Sumo Logic
Overview: Sumo Logic’s observability solution makes it easier for DevOps and information security teams to monitor systems and microservice-based applications from a single platform that covers performance metrics, log and event data, and distributed transaction tracing. Sumo Logic also acquired Sensu, a continuous monitoring tool that delivers monitoring-as-code, alerts, and auto-remediation for cloud native applications.
In addition to APM capabilities, Sumo Logic offers a cloud-native SIEM tool to improve security controls, with correlation-based threat detection and support from the company’s own cyber threat-hunting team.
Use Cases: Application performance monitoring, cloud security monitoring, compliance, business intelligence.
Pros:
- Sumo Logic provides free product training and certifications
- Easy configuration of real-time metrics and alerts
- Visually appealing dashboards and graphs
Cons:
- Sumo Logic’s query language limits some analytic capabilities, especially low-level analysis of log data
- Performance issues and slow-downs when loading dashboards or performing long queries
- Missing support for all log sources
Unbiased Sumo Logic Review
Sysdig Monitor
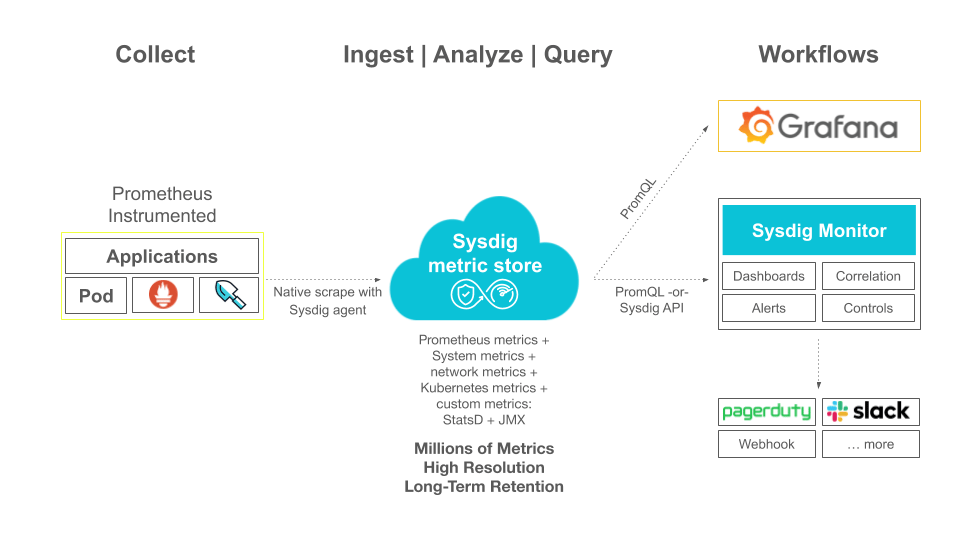
Image Source: Sysdig
Overview: Sysdig Monitor is a cloud monitoring tool that helps secure cloud environments while giving developer teams enhanced visibility into the infrastructure, applications, and services that comprise the DevOps pipeline.
A key differentiator for Sysdig is its compatibility with Prometheus. DevOps teams that have already invested in Prometheus can store and query native Prometheus metrics, and write queries using the Prometheus query language or API while benefiting from the native troubleshooting and event correlation features of Sysdig.
Use Cases: Prometheus monitoring, Kubernetes monitoring, network and container security, cloud security and workload protection.
Pros:
- Responsive and helpful customer support
- Out-of-box Prometheus and Kubernetes monitoring capabilities
- Prometheus Catalog, a curated repository of exporters, dashboards, recording rules, and alert definitions that Sysdig supports for its customers
Cons:
- Lack of durable, long-term data storage
- Complex implementation process
- High technical overhead to manage scaling, storage requirements, multiple exporters, and visualizations
Helpful Sysdig Monitor Review
Keep Tabs on Your Network, Infrastructure, and Applications
DevOps teams rely on continuous monitoring software tools for visibility into the performance and security of applications, infrastructure, and services in the cloud. Our list includes the most popular and widely used continuous monitoring tools we’ve encountered, highlighting their capabilities and key features along with drawbacks that limited their functionality for end users.
You can align DevOps with business needs by deciding what and how often to measure and facilitating collaboration between teams. If you’re an AWS-only shop, you can also check out our favorite cloud DevOps tools for AWS.
We hope this list helps broaden your perception of the current landscape of continuous monitoring tools in the marketplace and choose the best solution for your upcoming software development projects.
ChaosSearch is the only solution that transforms public cloud object storage into a functional data lake for log and security analytics. With our unique approach and proprietary technologies, we’re empowering enterprise DevOps teams with faster time to insights, multi-model data access, and unlimited scalability at a very low total cost of ownership. Many teams choose to use ChaosSearch for logs alongside other tools for metrics and traces to offer a best of breed observability approach.
And it takes just a few minutes to get started.


