

Datadog is a Software-as-a-Service (SaaS) cloud monitoring solution that enables multiple observability use cases by making it easy for customers to collect, monitor, and analyze telemetry data (logs, metrics and traces), user behavior data, and metadata from hundreds of sources in a single unified platform.
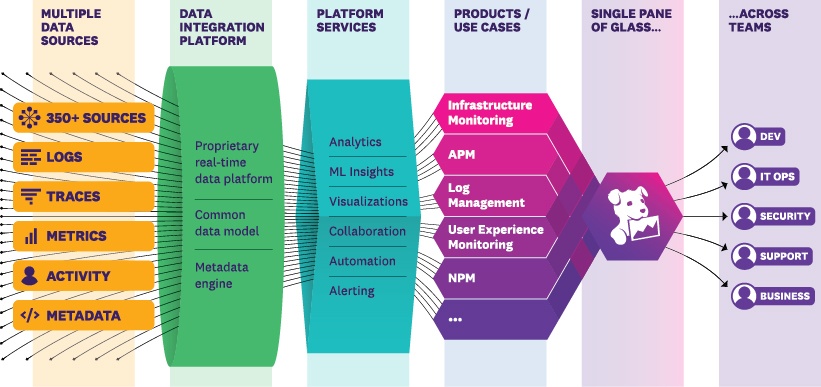
Datadog solution architecture
Datadog’s all-in-one approach and comprehensive capabilities have made it a market leader in cloud monitoring solutions, with gross earnings of $2.13 billion in 2023 and 27,300 customers (including 42% of the Fortune 500 companies) relying on Datadog for their cloud observability and analytics needs.
But despite Datadog’s growing popularity, the platform’s all-in-one approach to cloud monitoring may not work for everyone. A growing number of Datadog customers are using Grafana + Loki to replace Datadog for log management and analytics, citing Datadog’s complex log analytics workflows, high data ingestion and retention costs, and scaling challenges.
In this blog, we’re taking a closer look at the major differences between Datadog vs. Grafana + Loki for log analytics, and why a growing number of Datadog customers might be shifting their log analytics workloads away from Datadog in favor of Grafana + Loki.

Why Enterprise DevOps Teams Need Cloud Monitoring Solutions
Modern enterprises that build, deliver, and depend on cloud-based applications and services use cloud monitoring solutions like Datadog to support a variety of operational use cases.
1. Enabling Cloud Observability
Observability is the ability to monitor and measure the state of a cloud-based application or service using data generated by that service. Cloud monitoring solutions like Datadog collect and aggregate data from cloud infrastructure to give DevOps teams visibility into the performance, health, and overall status of cloud-based applications and services.
2. Solving Application Performance Issues
Cloud monitoring solutions allow DevOps teams to track vital application performance metrics, including response times, data throughput, and error rates. Monitoring application metrics helps enterprise developer teams identify bottlenecks and long-term performance trends, optimize application performance, and remediate application errors that negatively impact the user experience.
3. Security Threat Detection
Cloud monitoring solutions can track security-related events and anomalies within cloud environments, including failed logins, unauthorized access attempts, anomalous network traffic patterns, or suspicious user behavior. Enterprise security teams can integrate cloud monitoring with SIEM systems to correlate security data from multiple sources and enhance threat detection capabilities.
4. Root Cause Analysis
Enterprise DevOps and security teams can use historical telemetry data from cloud monitoring tools to investigate the underlying causes of a security incident, application performance issue, or unexpected service outage. Cost-efficient data storage and indexing techniques are used to support long-term storage of security data and enable use cases like root cause analysis and advanced persistent threat detection.
5. Understanding the User Experience
Cloud monitoring solutions track user behavior and interactions with cloud-based applications and services. DevOps teams can use this data to understand how customers are engaging with their applications, identify performance bottlenecks or drop-off points in the customer journey, and prioritize optimizations to enhance the user experience.
An Overview of Datadog vs. Grafana + Loki for Log Analytics
Datadog’s Approach to Log Management at Scale
Datadog started in 2010 as a real-time unified data platform, helping customers break down organizational data silos by offering a single analytics tool that could connect and ingest data from diverse sources throughout the enterprise.
Over the next decade, Datadog would introduce additional capabilities on top of the core platform, including cloud infrastructure monitoring, application performance monitoring (APM), real user monitoring (RUM), cloud security, and log management/analytics.
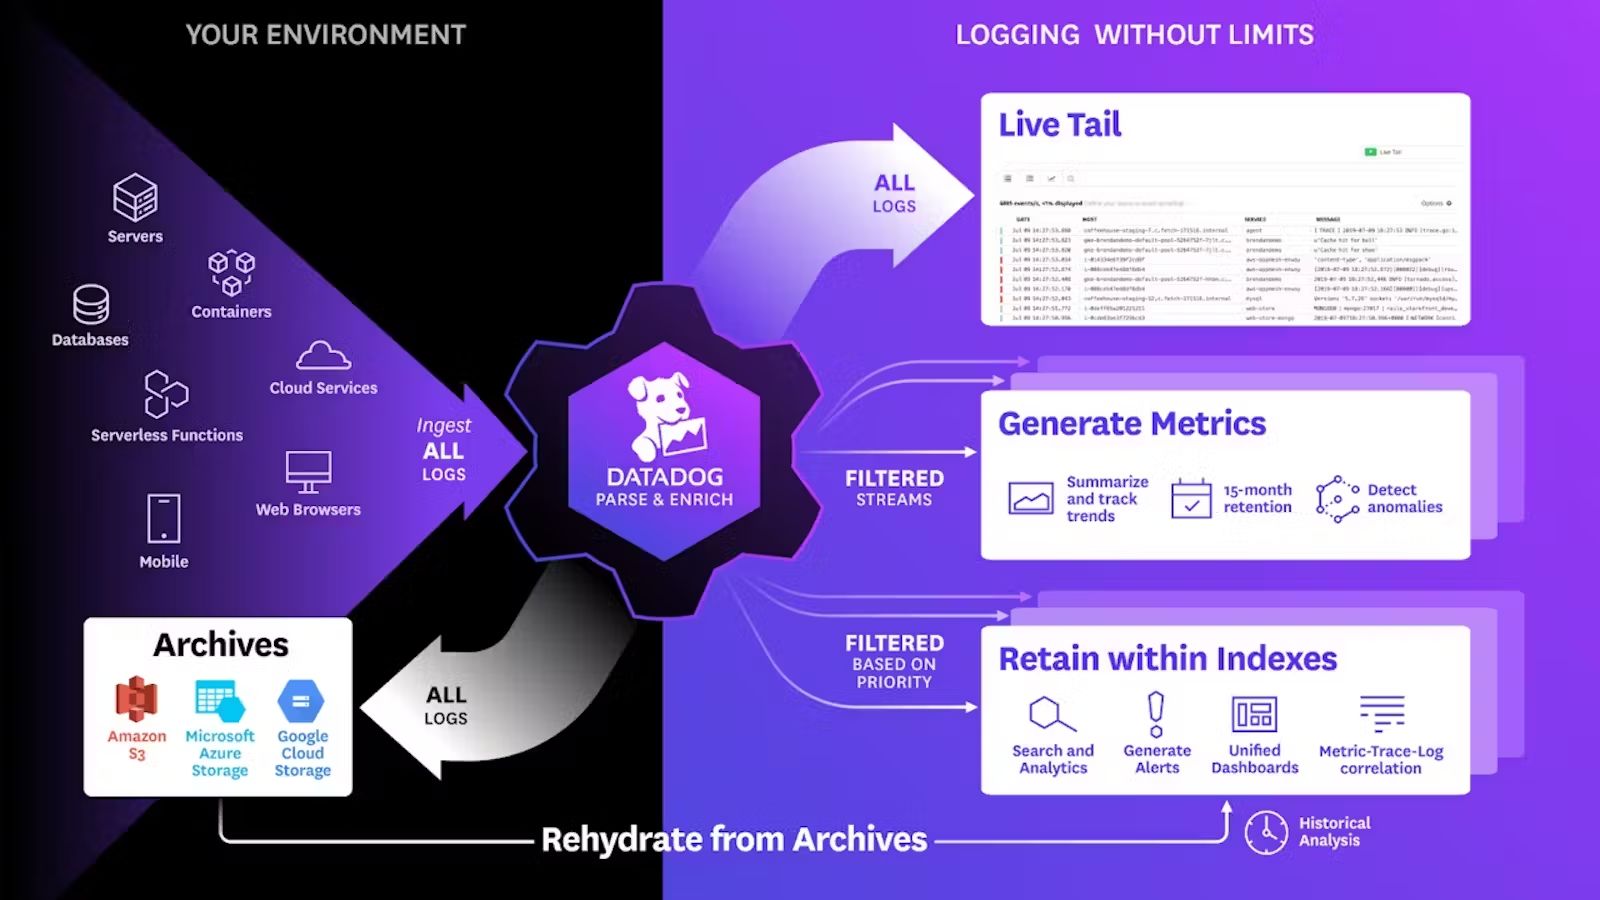
Datadog’s approach to log management at scale is to decouple log ingestion from indexing, allowing customers to ingest logs into Datadog at scale without necessarily having to index all of their data - a costly proposition for companies generating logs and terabyte or petabyte scale.
Instead, Datadog customers are encouraged to ingest all of their logs into Datadog, index only the logs desired for stream analytics or interactive exploration, and archive the rest in cloud object storage. If there’s a need to search through archived logs, Datadog customers can use Datadog’s Log Rehydration capability to pull archived logs from cloud object storage back into the platform for analysis.
How Does Log Management on Datadog Work?
1. Log Ingestion
After signing up for a Datadog account, customers can start to ingest logs from hosts, containers, cloud providers, and other sources into the Datadog back-end. Datadog provides three types of integrations that enable log ingestion:
- Agent-based integrations require customers to install the Datadog Agent, a lightweight software program that runs on local hosts, on-prem data centers, or in the cloud to collect and ship log data.
- Authentication-based integrations require customers to provide credentials for Datadog to access a secure system, collect log data, and transmit the logs using the Datadog API.
- Library integrations use the Datadog API to monitor, collect, and transmit log data from applications based on the programming language they use.
Datadog offers 700+ built-in integrations, so customers can ingest log data from a huge variety of sources. Log ingest pricing on Datadog starts at $0.10 per ingested or scanned GB per month.
2. Log Configuration
After setting up agents to ingest log data into Datadog, customers can use Datadog’s Log Configuration page to control what happens to their logs. Configuration options include:
- Processing log data using data pipelines and processors
- Configuring attributes and aliasing to standardize logs
- Configuring RBAC to control access to log data
- Generating metrics from ingested logs
- Indexing logs for live search
- Setting the retention period for specific log data
- Forwarding logs to other applications (for analytics use cases) or data repositories (for archiving)
The cost of retaining log data in Datadog depends on the desired length of data retention. Retaining logs for just 3 days incurs costs of $1.06 per million log events per month, while a 30-day retention period would incurs costs of $2.50 per million log events per month.
The cost of forwarding logs from Datadog to a custom destination starts at $0.25 per GB outbound, per destination, per month.
3. Log Exploration
Datadog customers can search, analyze, and visualize their indexed log data using the platform’s Log Explorer tool. There’s also the capability to rehydrate and analyze any logs that were previously archived in cloud object storage.

What is Grafana + Loki?
Grafana is an analytics platform that allows users to ingest data from various sources, query the data, and build customized visualizations to simplify analysis and reveal valuable insights. Grafana users can choose between the open-source Grafana OSS, which is free to install and use, or Grafana Cloud, a fully-managed Grafana service delivered by Grafana Labs.
Enterprise DevOps and security teams commonly use Grafana to analyze metrics data from Prometheus, an open-source systems monitoring tool developed by SoundCloud in 2012 and subsequently released as an open-source project.
Loki is an open-source log aggregation system released in 2019 by Grafana Labs (the same team responsible for Grafana). Heavily inspired by Prometheus (they use the same service discovery code, plus similar data models, architecture, and querying languages), Loki was designed for horizontal scalability, cost-efficiency, high availability, and ease-of-use.
Loki’s approach to log management is to index logs using metadata (specifically, using labels applied to the logs) instead of the full text of the logs themselves. Logs in any and all formats are grouped into streams and indexed with labels, resulting in smaller indices that use less storage and can be retained for longer and at less cost than Datadog or other competing solutions.
Grafana and Loki can be combined into a complete log analytics solution that enables the full spectrum of log analytics use cases (e.g. cloud infrastructure monitoring, APM, cloud security, etc.). Loki provides the functionality to label, transform, filter, and ingest logs in any format from a variety of sources, compress and index the logs using metadata, then store the indices in cloud object storage. From there, Grafana can be used to query and visualize the log data.
How Does Grafana + Loki Handle Log Management?
1. Transform and Ingest Logs with PromTail
PromTail is a log collection agent purpose-built for Loki. It allows users to label, transform, and filter log data before ingesting the log data into Loki’s back-end systems. Labels are key-value pairs assigned to logs at ingestion that act as metadata, allowing users to query, filter, and aggregate logs more efficiently. PromTail uses the same service discovery as Prometheus.
2. Index and Store Logs with Loki
When logs are ingested into Loki, the labels are extracted from the logs and indexed. Indexing maps the labels to the appropriate log entry, allowing users to quickly retrieve the log data they need by querying with specific label criteria.
The indexed log metadata is stored in Loki’s back-end, while the raw logs are compressed and stored in chunks in cloud object storage.
3. Query Logs in Grafana
Loki has its own query language called LogQL, which is similar to the PromQL language used in Prometheus. Grafana + Loki users can run LogQL or LogCLI queries in Grafana to visualize log data alongside data from other sources.
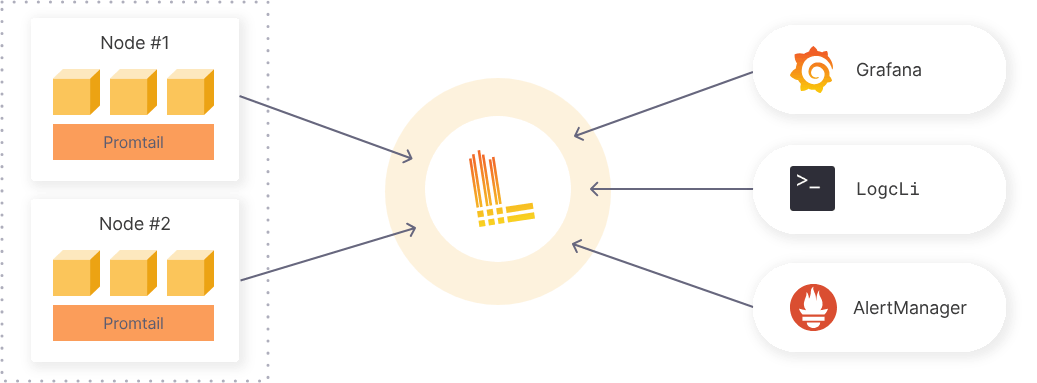
Basic Grafana + Loki solution architecture
4. Alert on Logs
Users can set up alerting rules in Loki, then send the resulting alerts to Prometheus AlertManager where they can be routed to security and incident response personnel.
Why Use Grafana and Loki to Replace Datadog for Log Analytics?
Datadog’s decoupling of log ingestion and indexing helps its customers reduce costs by selectively indexing their data, while Loki’s data compression and metadata indexing help reduce the size of log data in storage to enable more cost-effective log storage and long-term retention.
Both of these innovative approaches are clearly working for customers, so why would developers start using Grafana + Loki to replace Datadog for log analytics?
Here are five of the top reasons:
1. Reducing Log Analytics Costs
Datadog Logging is a proprietary solution that charges users on a pay-per-use basis to ingest, process, retain, or export log data. On the other hand, Grafana OSS and Loki are open-source solutions that don’t require ongoing license or subscription fees. Storing log data with Datadog can be prohibitively expensive at scale for organizations generating large volumes of logs, but an organization running Grafana + Loki on its own cloud infrastructure can leverage Loki’s cost-efficient indexing while avoiding Datadog’s costly data retention and ingress/egress fees.
2. Avoiding Data Retention Limits
Datadog provides log retention options ranging from 15 days to 1 year, but the high cost of storing data at scale frequently results in DevOps teams limiting data retention to reduce analytics costs. With Grafana + Loki, developers can take advantage of Loki’s indexing approach to reduce the cost of data retention, retain log data for longer periods, and support long-term analytics use cases like advanced persistent threat (APT) detection and root cause analysis.
3. Flexibility and Scalability
Because Datadog is a proprietary tool, developers are limited in the ways they can customize Datadog for their individual needs. The open-source nature of Grafana and Loki means that developers can build customizations or add-ons to extend their functionality as needed.
Datadog also requires developers to apply schema to their logs before indexing, while Loki operates on a schema-less, structureless data model and only adds structure to logs at query time. The result of this difference is that developers using Datadog must know before indexing which fields they want to analyze, while Grafana + Loki users can simply index all of their data and flexibly decide what to query later on.
4. Community Support
Grafana and Loki are popular open-source tools with large communities that contribute to their ongoing development and maintenance, freely sharing documentation and tutorials, new integrations and plug-ins, and helping other users troubleshoot problems. The strong presence of community support for open-source tools helps reduce the risk of switching away from a proprietary solution with vendor support.
5. Avoiding Vendor Lock-In
Datadog provides an all-in-one monitoring solution, but DevOps teams know that depending on a single vendor for everything observability can lead to in vendor lock-in, a situation where the difficulty and cost of switching vendors starts to outweigh the potential efficiency gains. Shifting log analytics workloads from Datadog to open-source tools like Grafana + Loki helps reduce vendor lock-in and gives DevOps teams more control of their data.
Reduce Datadog Costs Even Further with ChaosSearch
DevOps teams are increasingly facing challenges like high logging costs, restrictive data retention limits, and vendor lock-in when choosing an all-in-one analytics platform like Datadog for log management and analytics at scale. That’s ultimately why developers are switching to open-source tools like Grafana + Loki that can deliver log analytics with greater flexibility and lower costs.
Another great way to reduce Datadog costs is by implementing a modular observability stack that combines ChaosSearch with leading open-source tools and technology in a single architecture that enables metric monitoring, trace troubleshooting, and log investigation.
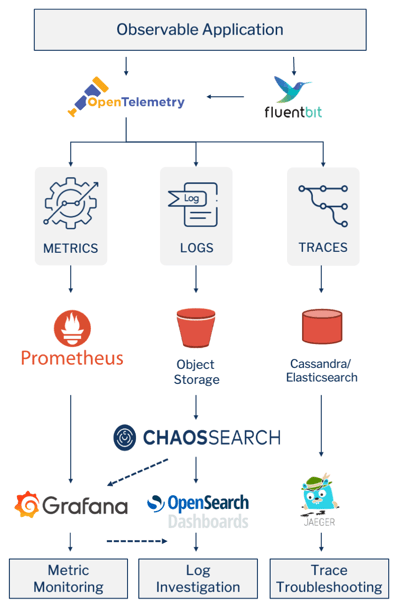
Sample architecture for a modular observability stack featuring Grafana and ChaosSearch.
In the sample architecture shown, DevOps teams can ship log data from observable applications to Amazon S3 or GCP cloud object storage using fluentbit, then index the log data directly in cloud object storage with up to 95% compression and no data movement or ETL process using ChaosSearch.
From there developers can take advantage of Grafana’s seamless integration with ChaosSearch via the Elasticsearch API and use Grafana to query, analyze, and visualize log data indexed by ChaosSearch.
Ready to learn more?
Download our Observability with ChaosSearch solution brief to discover how you can build a cost-effective, modular observability stack with open-source technology and powerful cloud-based solutions like ChaosSearch.

