

In my last blog post, Building a Cost-Effective Full Observability Solution Around Open APIs and CNCF Projects, we introduced using ChaosSearch in combination with the most popular open source front- and back-ends in the application observability space. In case you missed it, the TL;DR version is that you can use a variety of open source projects and open API-based components to build the best-of-breed observability stack of your choice rather than relying on expensive, all-in-one solutions.
READ: Beyond Observability: The Hidden Cost of Log Analytics
An example of a best-of-breed observability architecture is below.

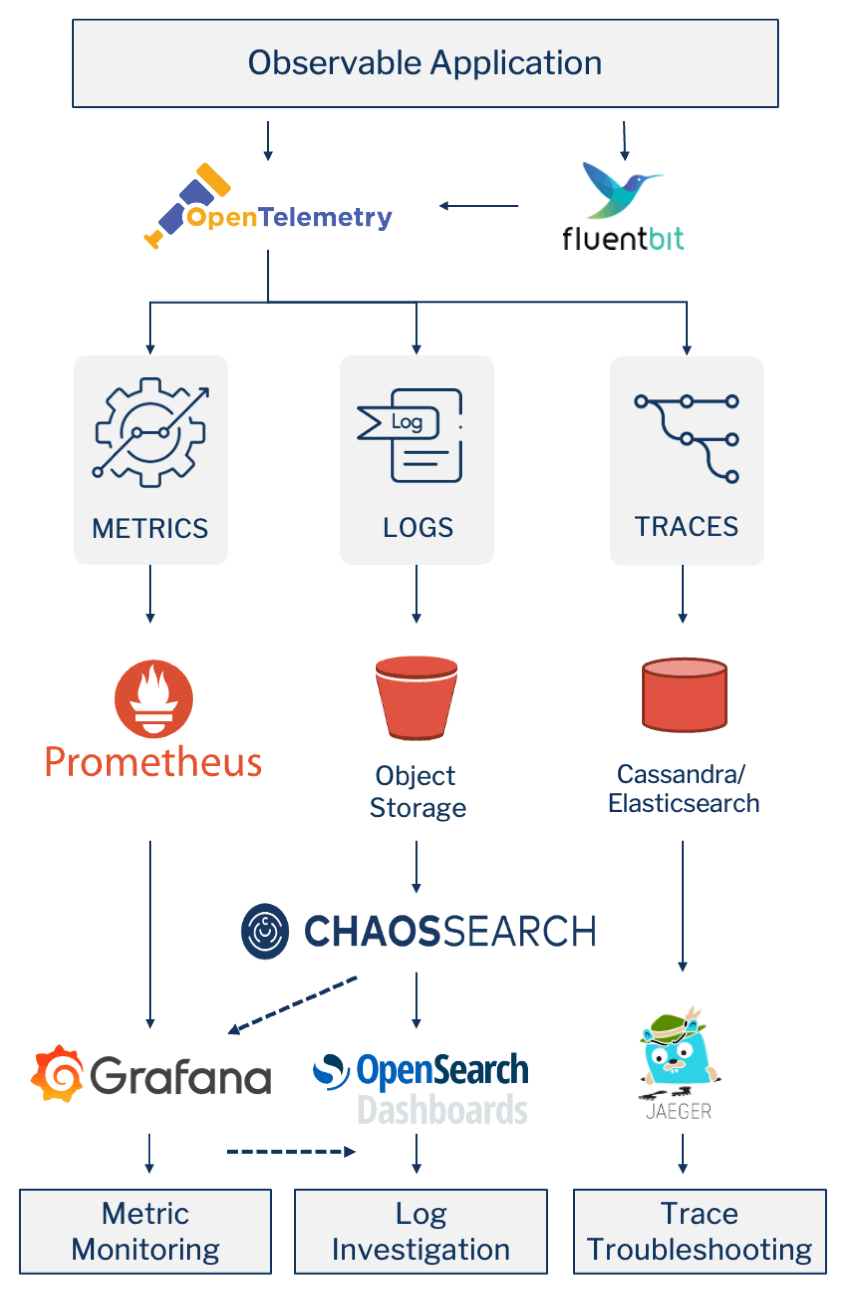
For DevOps and Ops teams that have bought into this best-of-breed and open approach, Grafana has become the visualization tool of choice for metrics monitoring and understanding. As a result, ChaosSearch has a number of customers who would prefer to use Grafana to investigate and visualize their logs, rather than using the OpenSearch or Kibana Dashboards user interface that ChaosSearch provides out of the box.
Luckily, ChaosSearch was built to be compliant with the Elasticsearch/OpenSearch API, and Grafana comes with an out-of-the-box Elasticsearch Data Source connector.
To use ChaosSearch as a data source in Grafana, follow these simple steps.
Configuring Your ChaosSearch Data Source
- Login to Grafana under an account with administration and configuration access.
- Go to Configuration → Data Sources and click the “Add data source” button
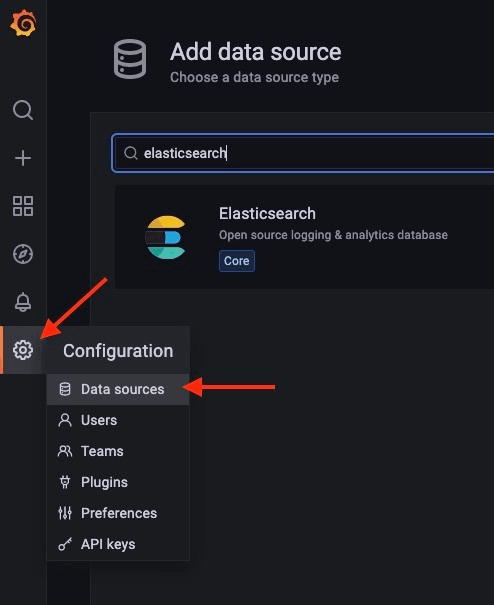
- Select ElasticSearch from the list of options
- In the ElasticSearch Settings enter the following values.
URL- The ChaosSearch url to access your data +/elastic- for example
https://domain.chaossearch.io/elastic Access- Server (default)Auth- Turn on SigV4 auth. If you don’t see SigV4 as an option, then you need to enable it in your config file or docker-compose file.sigv4_auth_enabled = true- To enable via the Docker command line, add this to the command
-e GF_AUTH_SIGV4_AUTH_ENABLED=true- For example:
docker run -d -p 3000:3000 -v "$(pwd)"/grafana-plugins:/var/lib/grafana/plugins -e GF_AUTH_SIGV4_AUTH_ENABLED=true --name=grafana grafana/grafana-ossSigV4 Auth DetailsAuthentication Provider- select Access and Secret KeyAccess Key ID & Secret Access Key- These are the API keys from Settings → API Keys in ChaosSearch Kibana.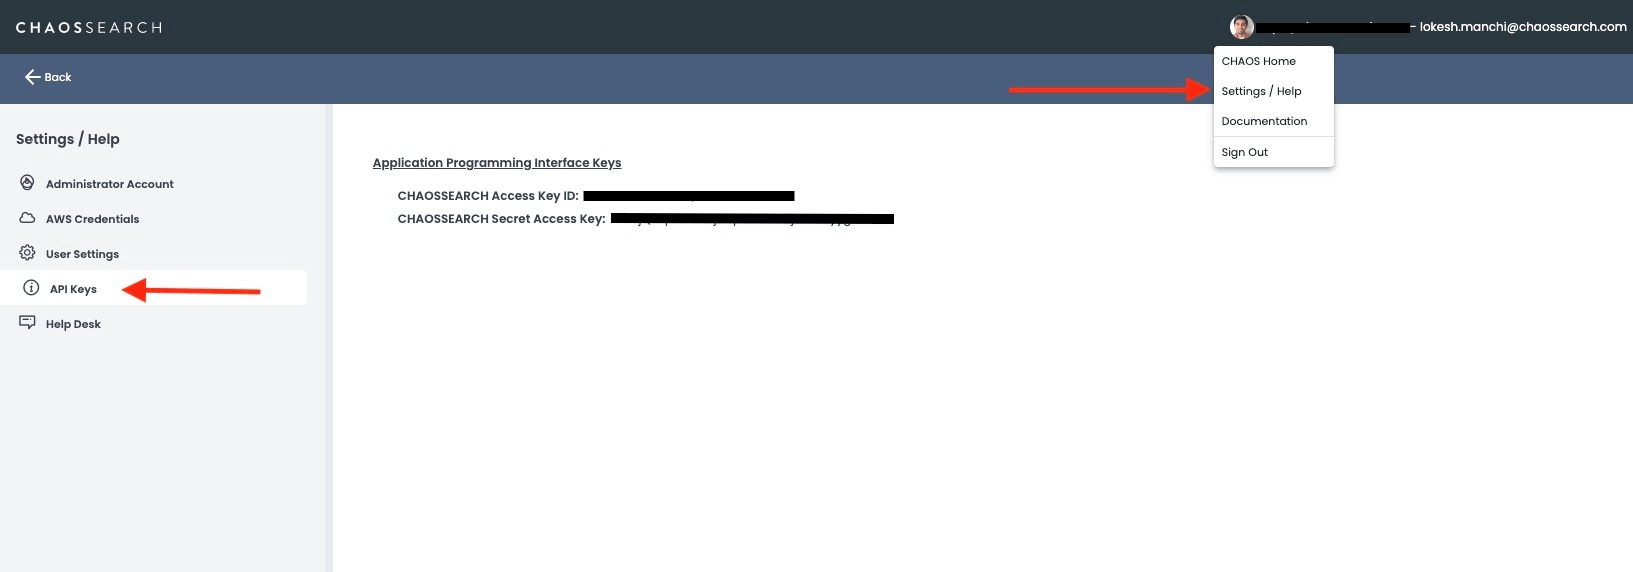
Default Region- Select the region where your cluster is deployedElasticsearch DetailsIndex name- The name of the view from the ChaosSearch Refinery tabTime field name- the name of the time field. Make sure this matches the exact same field name as in the index type.- For example -
@timestamp Version- Select the version of Elasticsearch that is deployed. 7.10+ is selected in this exampleLogsMessage field name- The name of the field that contains the full text of the message. This is required to use Grafana’s Logs Visualization described below.- For example
_sourceormessage 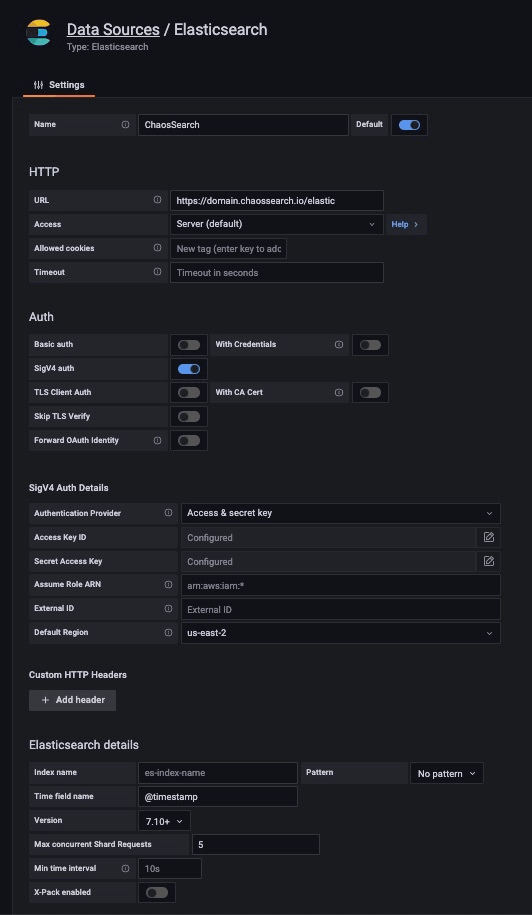
- After the above changes are made, click on “Save & Test” at the bottom.
- If you get a red error message, please check the settings again. Some common mistakes may include region, index-name and version.
- Once you get a green check, you are good to query and make graphs and dashboards.
Highlights: Exploring Your Log Data in Grafana
You are now ready to gather information using the ChaosSearch data source, just as you would any other Grafana data source.
The biggest difference between exploring ChaosSearch in Grafana vs. other data source types in Grafana is that the Query string is written in the Lucene query syntax rather than the Kibana Query Language (KQL) syntax more commonly used in Kibana and ChaosSearch.
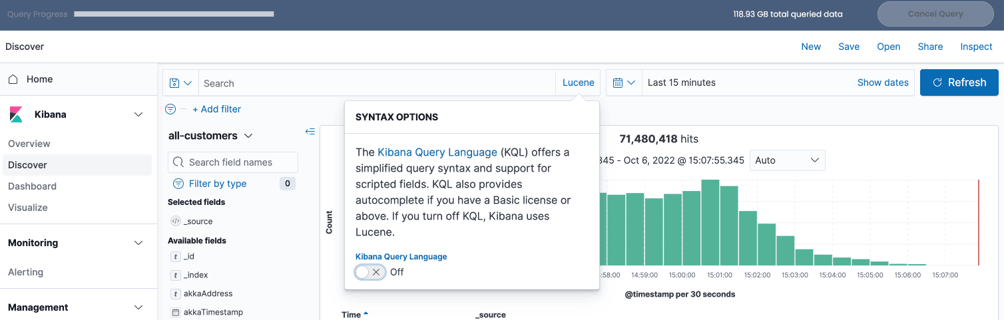
To try out the correct Lucene Query in ChaosSearch’s embedded Kibana interface:
- Go to ChaosSearch → Search Analytic → Discover
- Select the “KQL” button to the right of the Search bar
- Turn the Kibana Query Language toggle to “Off”
Creating Dashboards
In Grafana, you create Dashboards against ChaosSearch as a data source, the same as you would with other data sources. But, against this data source, Grafana has added in a visualization type named Logs to make Grafana work more like Kibana Discover.
In order for this Logs visualization to work you needed to correctly configure both the Time field name and Message field name when setting up the data source (see “Configuring Your Data Source” section above).
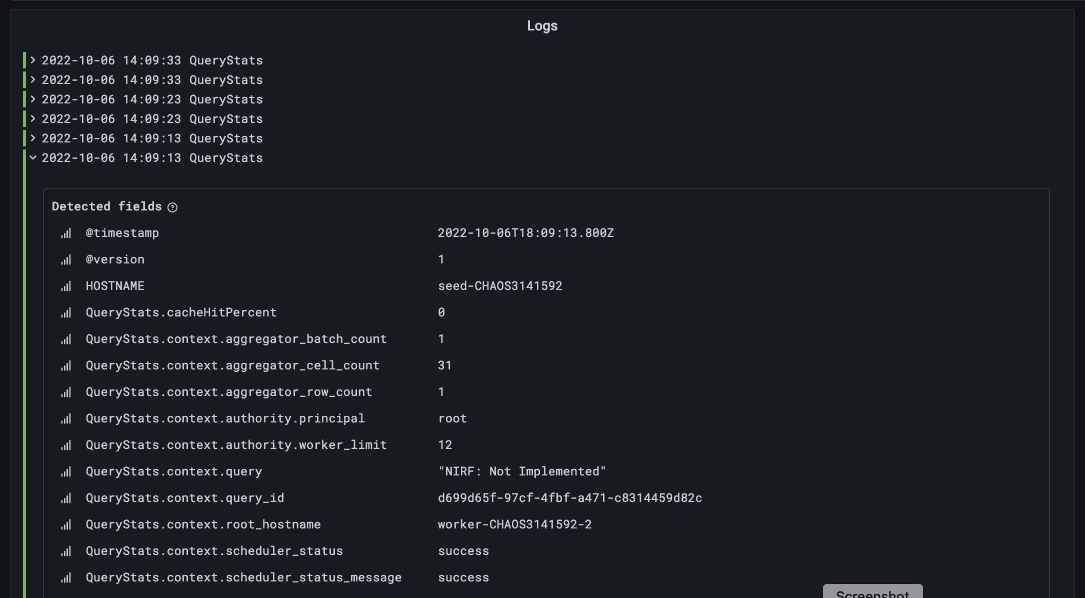
When configuring the Logs visualization, choose your option in the Logs section of the configuration panel. You will most likely want to at least turn “Time” and “Enable log details” on. The latter will allow you to expand out an individual log to see all of its fields, like in Kibana Discover.
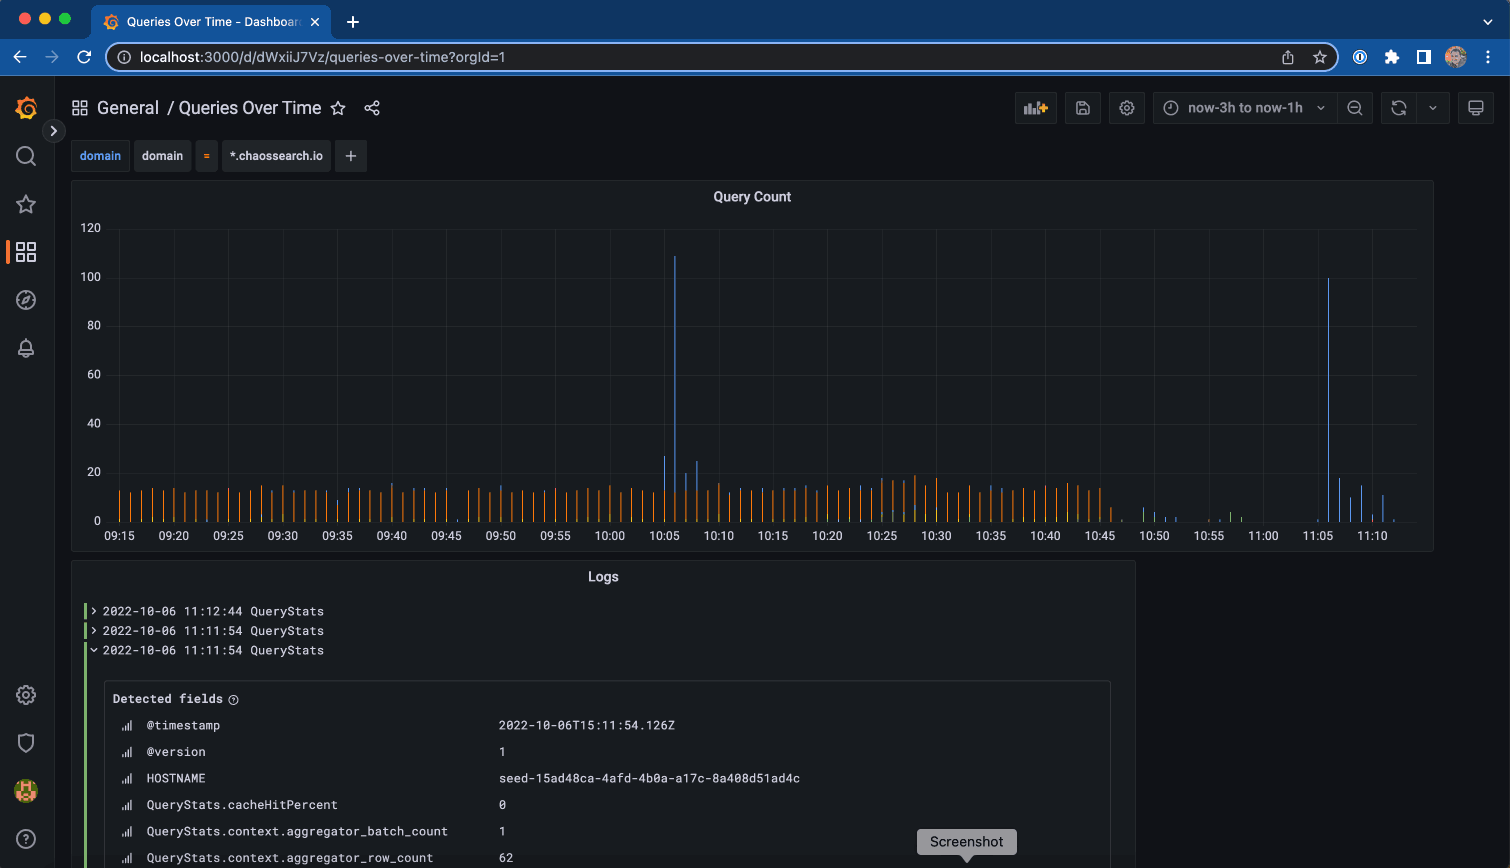
Once you have followed the steps to getting set up, your completed dashboard will look something like this
READ: Managing Cloud Service Logs: Why It’s Difficult and How to Simplify It
Conclusion
Following the steps above, it’s easy to set up your Grafana instance to work with ChaosSearch, just as you would with Kibana or OpenSearch dashboards. In a best-of-breed architecture, you should be able to use the tools you like best and are strongest for the task at hand. That’s why ChaosSearch was built with an API-first approach, in hopes that more companies would tap into the benefits of best-of-breed observability architectures – including lower costs, increased agility, and more flexibility for DevOps teams and SREs. Happy log hunting!

Additional Resources
Read the Blog: How to Create a Dashboard in Kibana
Listen to the Podcast: Trends and Emerging Technologies in Data Analytics
Check out the eBook: BEYOND OBSERVABILITY: The Hidden Value of Log Analytics

