

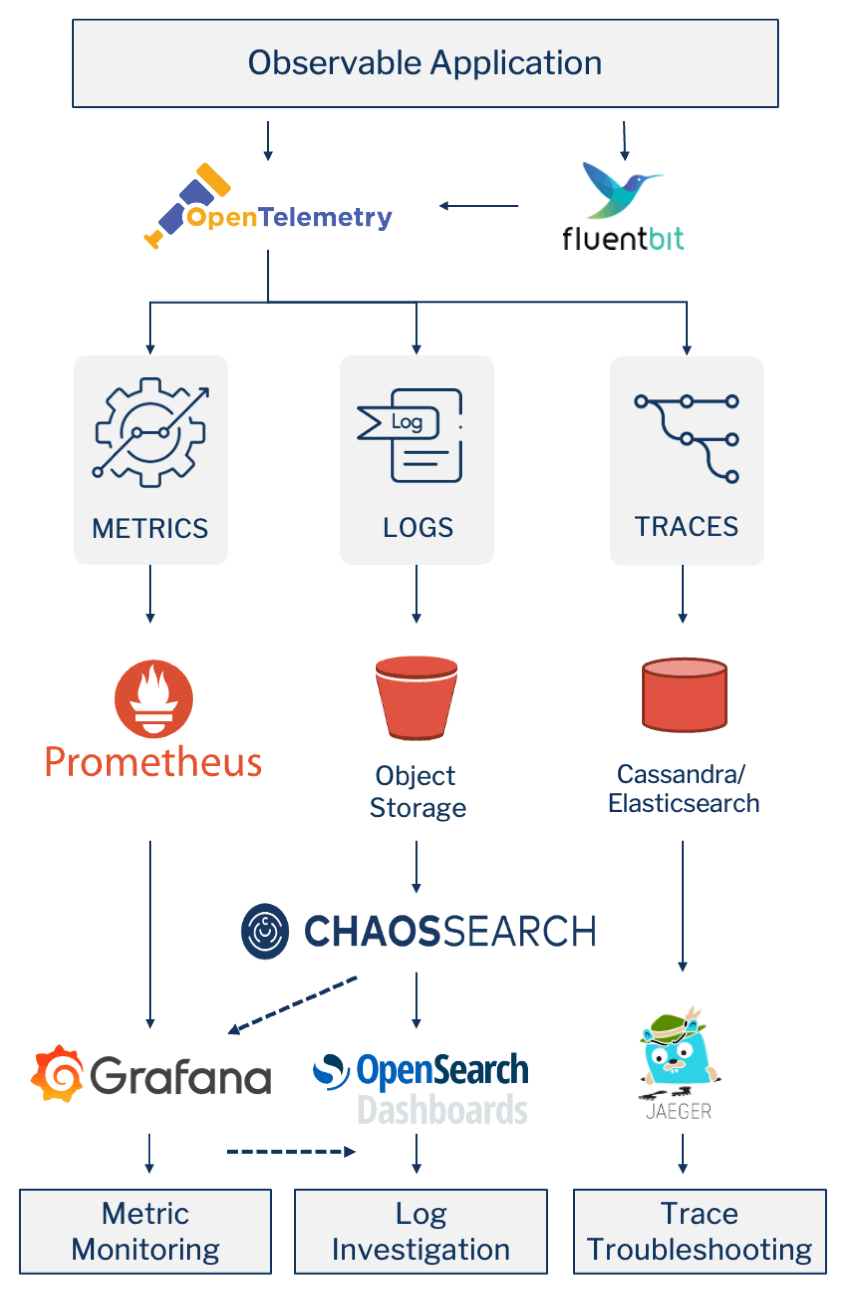
A full Observability stack has the goal of providing full centralized visibility to Development, Operations and Security teams into all of the Metrics, Logs and Traces generated by the applications and services under their domain.
Many companies address these observability needs by buying a complete application performance management (APM) solution from a single vendor, like DataDog.
Other companies, whether because of cost, functionality or fear of being locked into a single vendor, choose to put together their own best-of-breed observability solution. Most of the reasons for taking this approach naturally lead these companies to look at open source tools or at least open APIs.

READ: How to Overcome Datadog Log Management Challenges
The Cloud Native Computing Foundation (CNCF) is the open source, vendor-neutral hub of cloud native computing with the goal of making cloud native universal and sustainable. The CNCF hosts open source applications as well as open API projects that are directly targeted at Observability, including OpenTelemetry, fluentd, Prometheus, and Jaeger.
When combined with their logical, open application or API extensions you can put together a flexible, future proof and cost-effective stack for complete application observability.
Observability Data Instrumentation & Collection
Observability lets us understand a system from the outside by letting us ask questions about that system without knowing its inner workings. Furthermore, it allows us to troubleshoot easily and handle novel problems (i.e., “unknown unknowns”) and helps us answer the question, “Why is this happening?”
To be able to ask those questions of a system, the application must be properly instrumented. That is, the application code must emit signals such as traces, metrics, and logs. The instrumented data must then be sent to an Observability back-end or database for later monitoring & analysis.
In the past, the way in which code was instrumented would vary, as each Observability back-end would have its own instrumentation libraries and agents for emitting data to the tools.
This meant there was no standardized data format for sending data to an Observability back-end. Furthermore, if a company chose to switch Observability back-ends, it meant that they would have to re-instrument their code and configure new agents just to be able to emit telemetry data to the new tool of choice.
With a lack of standardization, the net result is the lack of data portability and the burden on the user to maintain instrumentation libraries.
Recognizing the need for standardization, the cloud community came together to address these issues as the OpenTelemetry open-source project sponsored by the Cloud Native Computing Foundation (CNCF).
OpenTelemetry is a collection of tools, APIs, and SDKs used to instrument, generate, collect, and export telemetry data (metrics, logs, and traces) to help you analyze your applications’ performance and behavior.
Application developers can use the OpenTelemetry libraries to send observability data directly to the OpenTelemetry Collector or by using an externally running agent, like CNCF’s Fluent Bit project, to read from currently generated text files (event logs) and forward them onto the OpenTelemetry Collector.
READ: Going Beyond CloudWatch: 5 Steps to Better Log Analytics & Analysis
Metric Monitoring
Metrics are numeric measurements. What users want to measure differs from application to application. For a web server, it might be request times; for a database, it might be a number of active connections or active queries, etc.
Metrics play an important role in understanding why your application is working in a certain way. Let's assume you are running a web application and find that the application is slow. You will need some information to find out what is happening with your application. For example, the application can become slow when the number of requests is high. If you have the request count metric, you can spot the reason and increase the number of servers to handle the load.
Metrics are typically recorded over time… and as the CNCF’s time series database for observability, Prometheus is the most popular open-source systems monitoring and alerting toolkit.
And Grafana is the de facto front-end user interface for monitoring, querying, visualizing, dashboarding and alerting on metrics stored in the Prometheus time series database. While not sponsored by CNCF, Grafana Labs (who is also the lead developer for Prometheus) offers both open and commercial versions of Grafana. While Grafana and Prometheus are primarily used together, as we will delve into below, one of Grafana’s key features is that it can be used against multiple back-end databases.
Log Investigation
A log is an immutable record of discrete events that happened over time, usually stored as a semi-structured text file, like CSV or, increasingly, JSON.
Because these text files are flexible in terms of schema and the exact questions that users ask of them aren’t known in advance, a document store and text-based search are a perfect fit for log observability and investigation.
The OpenSearch project consists of a data store and search engine (OpenSearch) based on Apache Lucene, and a visualization and user interface (OpenSearch Dashboards). OpenSearch is the successor of the very popular ELK Stack (Elasticsearch + Logstash + Kibana) developed by Elastic. In 2021, Elastic stopped offering their products under open source licenses and OpenSearch was created to continue supporting the open source branches.
In many instances the open source offerings are indeed the most cost-effective option for companies. However, the core architecture of Lucene and OpenSearch (Elasticsearch) is widely known to be difficult and expensive to operate reliably in production at large data volumes and scale.
ChaosSearch was architected from the ground up to eliminate the complexity that leads to the challenges and expense of OpenSearch/Elasticsearch at scale. ChaosSearch is a cloud data platform that provides the same functionality without being based on Apache Lucene or OpenSearch (Elasticsearch). But since it exposes the exact same Elasticsearch API, it is a direct and easy replacement. Any analytics tool that relies on the OpenSearch API for performing log analytics will work with ChaosSearch’s engine. OpenSearch Dashboards (Kibana) is the most widely used search-based log investigation user interface based on this API and is shipped with ChaosSearch.
OpenSearch Dashboards has a number of different features:
- Discover for free-form ad hoc investigation via search-based queries
- Visualize for creating and saving charts
- Dashboard for putting together and sharing sets of pre-built charts
- Alerting for managing the metrics for the core analytics engine to continuously monitor and alert on when the specified thresholds are exceeded
Drilling from Grafana Metrics to Kibana Logs
Metrics and Logs are not used in isolation from each other. They might be utilized in different tools and even by different personas & users, but both are needed to address the end-to-end problem of observability.
The process typically starts with Metrics Monitoring. The operations team is continuously looking at the streams of metrics to find something in that stream that stands out as usual in some way. A “Potential Problem” has been identified.
Potential Problems that follow a previously unknown pattern have to be discovered by humans visually monitoring the metric stream in a tool like Grafana. Once a new pattern is found, it can then be turned into a rule for automation so that the Grafana backend is continuously checking for the pattern and alerting a human or another service when a threshold is reached… which indicates there is a new Potential Problem.
The queue of Potential Problems then needs to be explored and triaged by a human, again usually in Grafana, in order to determine whether the Potential Problem is a “Real Problem” or “Not a Real Problem” (“False Positive''). This is done by looking at the context of the Potential Problem. How does this situation compare to what we’ve seen in the past? What were we seeing in other related metrics streams around the same time?
Once a Potential Problem has been determined to be a Real Problem, the priority of addressing it may also be answered by looking at the context in Grafana. How many systems or users are likely affected by the Real Problem?
At this point, a Real Problem and its priority have been identified, but the real goal is to fix the Problem. The metrics stream has enough to tell WHAT the problem is from the end user of the services’ perspective (for example, “average page load time has increased 3x over the last hour in our East Coast data center compared to yesterday”), but it doesn’t tell us anything about WHY we are seeing this or how to address it. The answer to the WHY isn’t in the metrics; it’s in the logs and traces.
You could just open a ticket to start the Root Cause Analysis (RCA) Investigation by typing out the problem statement (again, for example, “average page load time has increased 3x over the last hour in our East Coast data center compared to yesterday”). But that removes the context of what has been learned so far from the metrics and makes the Log Investigator start completely over from scratch.
Instead, you can instrument Grafana to pass the context (or at least a large subset of the context) of the Real Problem to Kibana, where the Log Investigator works.
READ: How to Create a Dashboard in Kibana
Generating Metrics from Event Logs
The other main way in which the worlds of Metrics and Logs work together is through the use of Log-Based Metrics in Grafana-based Metrics Monitoring. Log-based metrics derive metric data from the content of log entries. For example, the metrics can record the number of log entries containing particular messages, or they can extract latency information reported in log entries.
For log-based metrics there is a direct integration between ChaosSearch and Grafana-based Metric Monitoring. As alluded to across multiple sections above:
While OpenSearch Dashboards (Kibana) only supports the OpenSearch (Elasticsearch) search-based API, Grafana is a much more generic dashboard visualization tool that supports many backend APIs. One of those that it supports natively is the OpenSearch (Elasticsearch) search-based API… which ChaosSearch exposes.
So a single Grafana dashboard can contain one visualization based on a Prometheus-stored metric stream that was generated directly in an application/services and a second visualization that is connected directly to ChaosSearch-stored logs that are aggregated into a metric at the time of query and display.
Trace Troubleshooting
Jaeger is the CNCF-sponsored open source system for monitoring and troubleshooting distributed systems via traces. It can be used for:
- Distributed context propagation
- Distributed transaction monitoring
- Root cause analysis
- Service dependency analysis
- Performance/latency optimization
The Jaeger backend natively receives trace data from the OpenTelemetry SDKs in their native OpenTelemetry Protocol (OTLP).
Jaeger supports two popular open source NoSQL databases as trace storage backends: Cassandra and Elasticsearch.
The interaction of traces with metrics & logs will be the focus of a future blog post.
Conclusion
There are valid tradeoffs between using a single Full Stack Observability Solution or putting one together through Best-of-Breed Observability Components. For those choosing the latter or to use best-of-breed components to augment their full application performance monitoring (APM) solution, the Cloud Native Computing Foundation sponsors several observability-centric projects to serve as the foundation of your solution. This can then be combined with other open APIs and/or open source projects, like Grafana, OpenSearch Dashboards and ChaosSearch’s OpenSearch/Elasticsearch compliant log data store and analytic search engine.

Additional Resources
Read the Blog: Centralized Log Management and APM/Observability for Application Troubleshooting and DevOps Efficiency
Listen to the Podcast: Differentiate or Drown: Managing Modern-Day Data
Check out the eBook: Beyond Observability - The Hidden Value of Log Analytics

