

As we head into the holidays, there’s no better time to talk about bringing people together. And there’s no better way to bring employees together within a company aspiring to be data-driven than with a data literacy program. What data analytics processes should your organization put into place to increase data literacy? It all starts with establishing a training program to empower your people to work with data, regardless of their level of expertise. Mastering this process, however, involves gaining executive buy-in, designing data literacy training for multiple levels, and effectively measuring and reporting on the initiative’s success.
Gartner defines data literacy as “the ability to read, write and communicate data in context, including an understanding of data sources and constructs, analytical methods and techniques applied, and the ability to describe the use case, application and resulting value.” While this sounds somewhat simple in theory, in practice, only 21% of people are confident in their data literacy skills.
In this segment of our Data Literacy blog series, we’ll cover the processes that can unlock data literacy in your organization.
IN CASE YOU MISSED IT: Unlocking Data Literacy Part 1: How to Set Up a Data Analytics Practice that Works for Your People
Why a data literacy training program matters
According to Dataversity, 93% of business decision makers believe that data literacy is relevant to their industry, and that it’s important for their employees to be data literate. Even so, only 34% of organizations currently provide data literacy training.
A first step toward mobilizing these programs in an organization involves gaining executive buy-in. For C-levels that need more convincing, a study from the Data Literacy Index found that enterprises that have higher corporate data literacy scores can have $320-$534 million higher market capitalization.
Designing a data literacy training program
Once the executive team buys into the data literacy training program, it’s time to design a process that works for your people. A one-size-fits-all approach likely will not work, since people will have varying levels of confidence working with analytics tools. Gartner recommends that data and analytics leaders assess the skills of their organization first, using the following questions:
Questions to Assess Data Skills in Your Organization
- How many people in your business can interpret straightforward statistical operations such as correlations or judge averages?
- How many managers are able to construct a business case based on concrete, accurate and relevant numbers?
- How many managers can explain the output of their systems or processes?
- How many data scientists can explain the output of their machine learning algorithms?
- How many of your customers can truly appreciate and internalize the essence of the data you share with them?
From there, it's important to design a program that works for varying levels of expertise. To address this issue, European retailer Bol.com designed a data literacy program framework that outlines courses for different levels of maturity to meet people at their current skill levels. The program runs across three key categories that map back to Gartner’s earlier definition of data literacy: Reading, Writing, and Speaking (or Communicating, in Gartner’s terminology) data. Below is a snapshot of Bol.com’s framework.
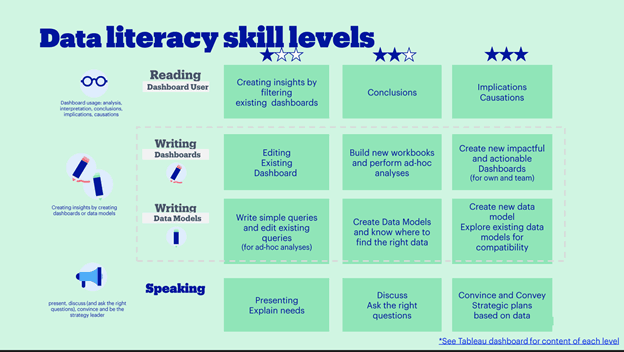
Source: Retail IT Insights and Bol.com
As we mentioned in Part 1 of our blog series, there are a variety of resources available for data literacy training courses online. There may not be a need to start from scratch if you leverage publicly available courses, taking care to map them back to your team’s current skill levels.
Measuring your training program’s success
A critical part of maintaining a data literacy training program is measuring its success, and reporting those results back to your executive champions. Measurable progress is the best way to sustain a culture of continuous improvement around data literacy.
Deloitte recommends using ongoing assessments to steer progress of these training initiatives after completing a baseline assessment of data literacy maturity. As an example, a global insurance firm segmented their workforce into groups that included Discoverers, Explorers, Practitioners, and Ambassadors based on their level of data literacy and their roles within the workforce. Like the Bol.com example above, the insurance company targeted training to deepen each group’s specific area of expertise.
Rather than allowing users to self-report their success, repeating the same assessment on a quarterly basis can help organizations monitor progress. If progress isn’t happening as expected, the data and analytics team can rethink the nature of the courses they’ve designed, and refine them. It helps if courses are directly applicable to how the user will apply data science to their day-to-day job.

Removing data access barriers for business users
A foundational part of empowering business users to become citizen data scientists is removing some of the barriers to data access that exist in the first place. Self-service business intelligence (BI) has long been touted as the answer to getting business users access to the data they need. In reality, many of these tools are far from self-service. A lot of prep work is still needed behind the scenes to get the data ready for analytics consumption.
Many organizations rely on data engineering teams to work within the constraints of the existing enterprise data architecture. This often involves data warehouses that limit the utility and impact of big data. Data warehouses follow a schema-on-write approach, meaning that the data must have a defined schema before writing into the database. As a result, all warehouse data has been previously cleaned and transformed, usually via some iteration of an extract, transform and load (ETL) process. When BI teams access the data warehouse, they’re accessing processed data - not raw data.
A big drawback to this approach is that the data engineering team typically has limited resources. In the ETL process, data is captured from transactional databases and other sources, transformed in a staging area, then loaded into an online data/analytics warehouse where business intelligence (BI) teams can run queries.
But as organizational data assets continue to grow at 30-40% per year, the ETL process is not getting 40% faster. This often leaves enterprise data teams with a tough choice: use less data to speed up processing times, or accept the increase in time-to-insights.
To address these challenges, many organizations are turning to a cloud data platform. This approach combines elements of data warehouses and data lakes, seeking to integrate myriad data points, generate insights, and create business value. It transforms and delivers data to business intelligence (BI) and data science tools, as well as applications that embed BI and data science algorithms.
We’ll get into more detail on this approach in Part 3 of our series, which will focus on the data management technology required to empower data literacy. This piece will help you kick off the new year with a holistic guide to establishing a data literacy program in your organization. ‘Til then, wishing you a restful, happy and healthy holiday season!

Additional Resources
Read the blog: IT Professionals Reveal Cloud Data Platform Highs and Lows of 2021
Watch the webinar: Modern Analytics: Data Lakes, Data Warehouses and Clouds
Download the white paper: Eckerson’s Ultimate Guide to Log Analytics

