

Many organizations use Amazon CloudWatch to analyze log data, but find that restrictive CloudWatch log retention issues hold them back from effective troubleshooting and root-cause analysis. As a result, many companies may be looking for effective ways to export CloudWatch logs to S3 automatically.
Let’s look at some of the reasons why you might want to export CloudWatch logs to S3 in the first place, along with some Amazon-native and open-source tools to help you with the process.

Why Export CloudWatch Logs to S3?
While AWS CloudWatch is a good service for basic monitoring and alerts, it does have its limitations for log analytics at scale. Let’s look at some of the pros and cons of Amazon CloudWatch.
First, AWS CloudWatch log retention can get expensive. Once you reach terabyte-scale with your logs (and wish to retain them beyond a short period of time such as a few days or a week), CloudWatch simply becomes too costly and difficult to use when it comes to diagnosing issues or identifying advanced persistent security threats.
Even though Amazon CloudWatch is great for metrics and real-time alerts, AWS CloudWatch process is less than optimal. Here are a few reasons why.
- Difficult to search logs: Searching logs across multiple streams isn’t easy. The user interface for CloudWatch can be far too complex for the simple task of searching logs, requiring a proprietary query syntax. Furthermore, analysis is log group-bounded.
- Hard to export log data: Moving data to Amazon S3 is difficult, not to mention the integration requires an AWS-specific code. Sometimes it makes more sense to store logs as text files in S3. That’s not always possible with some AWS services like Lambda that write logs directly to CloudWatch Logs.

Exporting Logs to S3
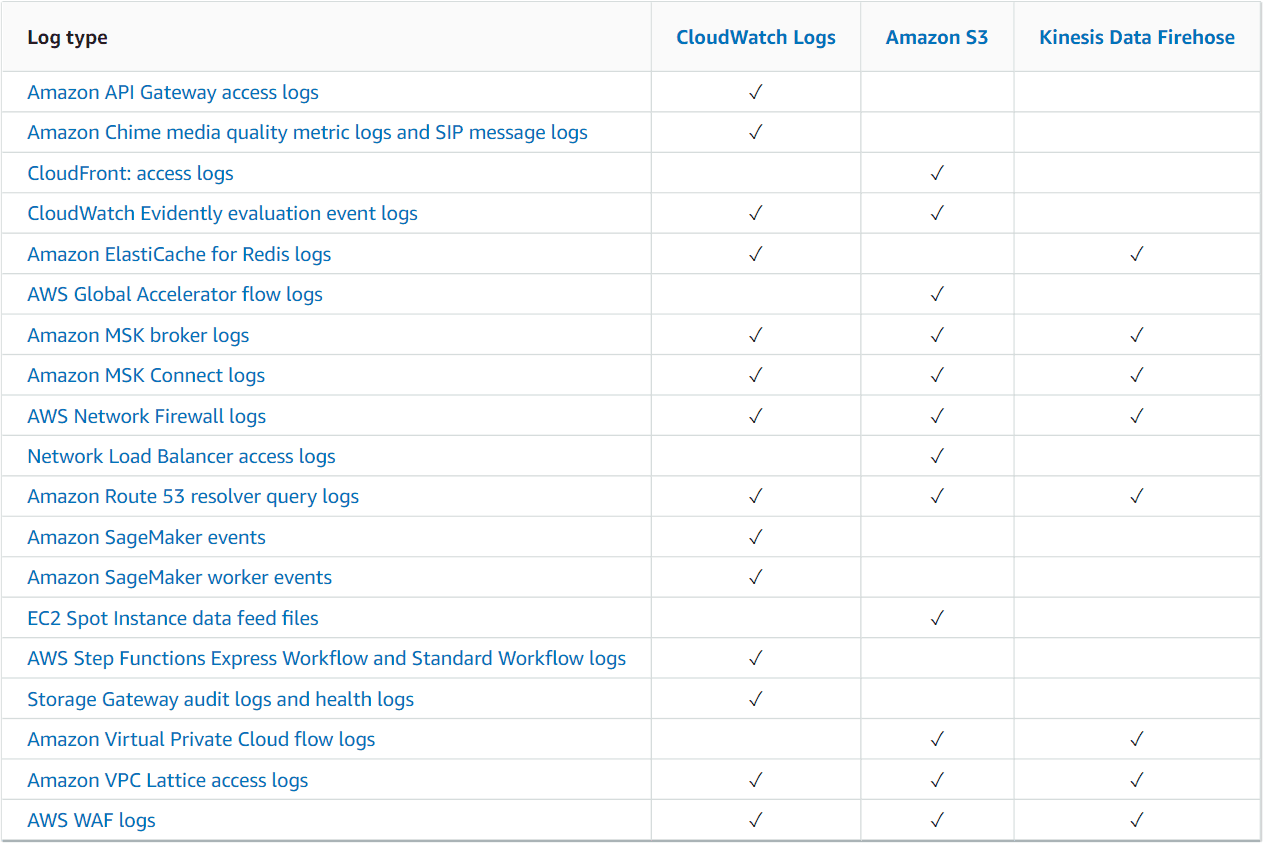
Fortunately, there are several options to get around the limitations of CloudWatch Logs by exporting logs to S3, where data can be stored and processed longer term for a lower price. There are some Amazon-native services that write logs directly to S3 allowing you to bypass CloudWatch altogether.
If you are trying to save money by exporting your logs to Amazon S3, make sure you change your retention settings in CloudWatch to purge your old logs. Otherwise, you may find that both your Amazon S3 and CloudWatch bills will continue to increase.
In addition, there are a few other AWS-native methods to export logs, as well as open-source tools for managing CloudWatch exports.
Using Amazon services to export CloudWatch logs data
Logs can be exported one-time or automatically as they come in. Setting up an automatic pipeline to export the logs is not a one-click process, but luckily Amazon detailed all the steps in the blog, Stream Amazon CloudWatch Logs to a Centralized Account for Audit and Analysis.
In fact, Amazon has many great blog posts about the topic and the proposed solution. In short, they create a Kinesis Stream writing to S3. Then, CloudWatch Logs subscriptions to export logs to the new stream are created either manually with a script or in response to CloudTrail events about new log streams.
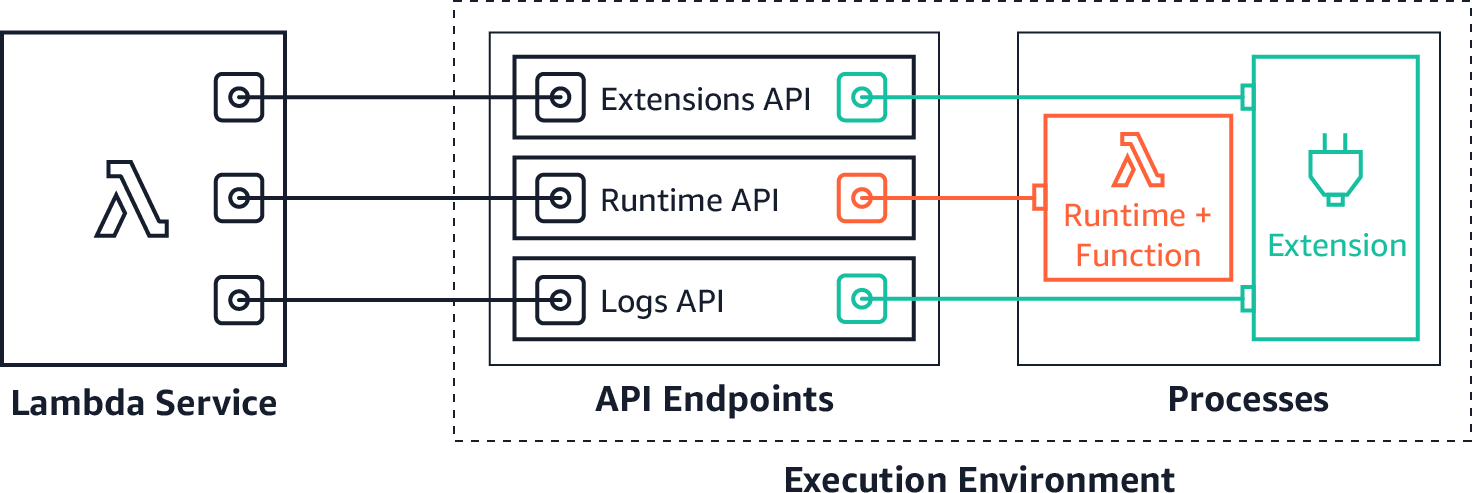
As of 2020, you can also use AWS Lambda extensions to send logs to custom destinations. Amazon S3, running as a Lambda extension, can now receive log streams directly from within the Lambda execution environment, and send them to any destination. This makes it even easier for you to use your preferred extensions for diagnostics. Amazon provides a tutorial on how to use AWS Lambda extensions to send Lambda logs to S3.
You can also see the ChaosSearch tutorial on how to export CloudWatch logs to S3 using Lambda.
How to Use CloudWatch2S3 to automate exports to S3 buckets
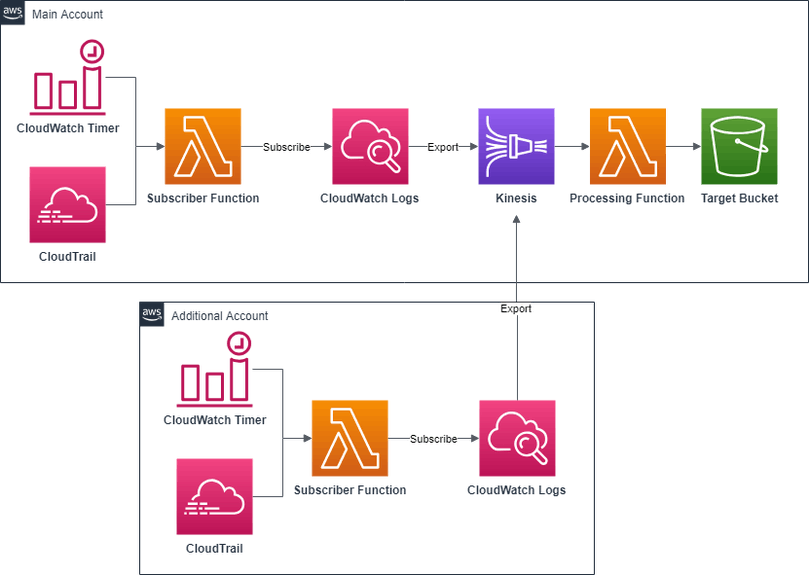
Open source tools such as CloudWatch2S3 can provide a single CloudFormation template that sets everything up in one go while still leaving room for tweaking with parameters.
The architecture is mostly the same as Amazon’s but adds a subscription timer to remove the hard requirement on CloudTrail, and post-processing to optionally write raw log files to S3 instead of compressed CloudWatch JSON files.
Setup is simple. There is just one CloudFormation template and the default parameters should be good for most.
- Download the CloudFormation template
- Open AWS Console
- Go to CloudFormation page
- Click “Create stack”
- Under “Specify template”, choose “Upload a template file”, choose the file downloaded in step 1, and click “Next”
- Under “Stack name” choose a name like “CloudWatch2S3”
- If you have a high volume of logs, consider increasing Kinesis Shard Count
- Review other parameters and click “Next”
- Add tags if needed and click “Next”
- Check “I acknowledge that AWS CloudFormation might create IAM resources” and click “Create stack”
- Wait for the stack to finish
- Go to the “Outputs” tab and note the bucket where logs will be written
- That’s it!
Another feature is the ability to export logs from multiple accounts to the same bucket. To set this up, you need to set the AllowedAccounts parameter to a comma-separated list of AWS account identifiers allowed to export logs. Once you create the stack, go to the “Outputs” tab and copy the value of LogDestination. Then deploy the CloudWatch2S3-additional-account.template to the other accounts while setting LogDestination to the value previously copied.
For troubleshooting and more technical details, see How to Export All CloudWatch Logs from Multiple Accounts to a Single S3 Bucket.
A better approach to log analytics at scale
Now that your logs are in Amazon S3 for long term retention — set up your S3 bucket for integration with ChaosSearch to be able to hunt, search, and visualize your log and event data across months and years.
Following these AWS logging tips, you can bypass CloudWatch and push logs directly into ChaosSearch. From there, the platform can index any data stored in S3 in the log, JSON, or CSV format. There is a huge ecosystem of log shippers and tools to transport data to Amazon S3 from Logstash and beats, Fluentd, Fluentbit to Vector, Segment.io, Cribl.io or programmatically from Boto3. This approach will allow you to avoid some of the limitations of CloudWatch log analytics, while taking advantage of the cost savings in S3.
Watch this quick demo to learn more:
Read: How to use Cribl Stream and ChaosSearch for Next-Gen Observability
ChaosSearch combines robust data indexing and querying capabilities with data lake economics for a best-in-class log management solution. That way, teams can ingest log and event data from all sources into Amazon S3, index the data with ChaosSearch’s proprietary technology, and rapidly achieve insights with no data movement or ETL processes.
Ready to get the most out of your log data analytics?
Compare the cost of ChaosSearch vs. CloudWatch


