

If you’re an Amazon Web Services (AWS) user, you’re probably familiar with some of Amazon’s native services available for logging and monitoring, such as CloudWatch and CloudTrail. With that said, log management can get complicated quickly, especially if you’re dealing with a high volume of logs from AWS Lambda functions or a multi-cloud/hybrid cloud environment.
In this blog, we’ll introduce the basics of AWS logging along with five tips and best practices for optimizing your log management in AWS.

What is AWS Logging?
AWS logging is the practice of aggregating, normalizing, indexing, and analyzing log data from cloud-based applications on AWS.
Log data consists of machine-generated records of events, user activity, and transactions that take place within an application or cloud service. Common types of log data include:
- Cloud Infrastructure Logs, which contain data related to the provisioning and management of cloud-based resources like storage, compute, and virtual machines.
- Application Logs, which log events, user behavior/activities, and transactions on cloud-hosted applications.
- Security Logs, which contain information about authentication, access control activities, intrusion attempts, and other cloud security events.
- API Activity Logs, which contain information about API calls executed by users and applications inside the user’s public cloud services account.
- Audit Logs, which contain information about changes to cloud resources or sensitive data.
Each time an event or transaction takes place on a logging-enabled system, the newly generated log data is written into a log file that establishes a chronological record of everything that happened within the application or service.
Log files from a variety of sources can be aggregated and analyzed to support a variety of different use cases:
- Enterprise DevOps teams depend on application logging for performance monitoring and deeper application insights, including bugs and errors that could negatively impact the customer experience.
- SecOps teams can analyze security and API activity logs to discover advanced persistent threats in AWS or identify anomalous user behavior that could indicate an intrusion attempt.
- Cloud engineers can analyze cloud infrastructure logs to troubleshoot the health of cloud services and optimize cloud resource allocation to maximize performance and availability while minimizing costs.
- Compliance teams can analyze audit and API activity logs to validate log file integrity and ensure compliance with security/privacy regulations.

5 AWS Logging Best Practices You Should Know
Getting logging right starts with how well you know the strengths and limitations of native AWS monitoring tools. Many times, you can build a cloud-native observability stack that complements these tools in areas where they become difficult to navigate. Here are five AWS logging best practices you can follow for analyzing logs more effectively.
1. Understand the differences between CloudTrail and CloudWatch
CloudWatch is Amazon's primary monitoring and logging service built into the AWS cloud. You can move logs to CloudWatch logs from all of your AWS services and workloads – from CloudTrail and EKS, to Route53, to individual EC2 instances running the CloudWatch agent, to Lambda functions. CloudWatch, through CloudWatch Logs Insights, provides basic search and analytics capabilities, such as visualizations, to help you interpret log and metrics data. And it lets you configure alarms, which can alert you to anomalies or sudden changes in workload performance patterns.
While AWS CloudWatch works well for basic monitoring and alerts, on its own, it may not be the best solution for log data at scale. Limitations include user interface and scalability issues can hold users back from utilizing logs in CloudWatch for troubleshooting use cases.
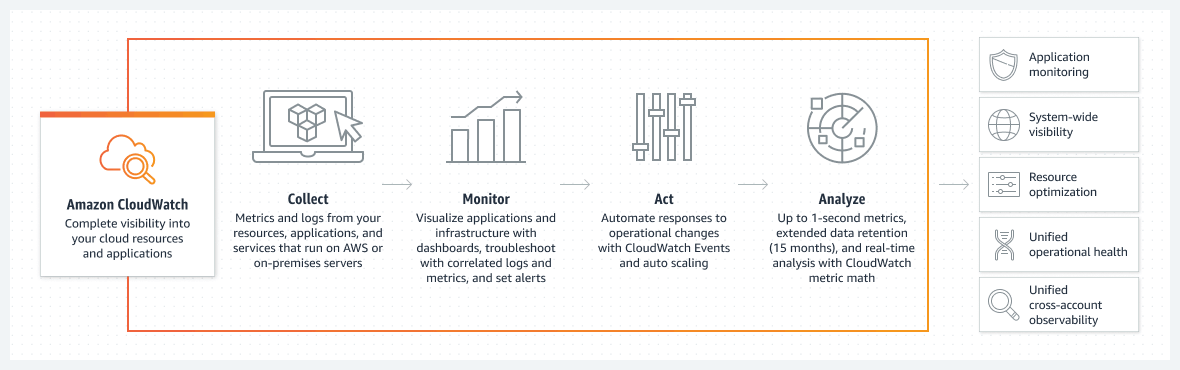
AWS CloudWatch collects and visualizes telemetry from cloud resources and applications in real-time.
CloudTrail is different from CloudWatch because it keeps a record of every API call within your AWS account (vs. the application- and service-level logs and metrics in CloudWatch). CloudTrail gives you deeper visibility into the activity within your account, helping you see who did what and when. You can use the CloudTrail logs not only to track the security of the user access but also for operational troubleshooting.
Historically, the native way provided by AWS to analyze CloudTrail data was a simple UI that lets you run some basic searches on events over the last 90 days worth of data. However, early in 2022, AWS delivered CloudTrail Data Lake, an additional service to store and enable querying of CloudTrail data using the familiar SQL query language.
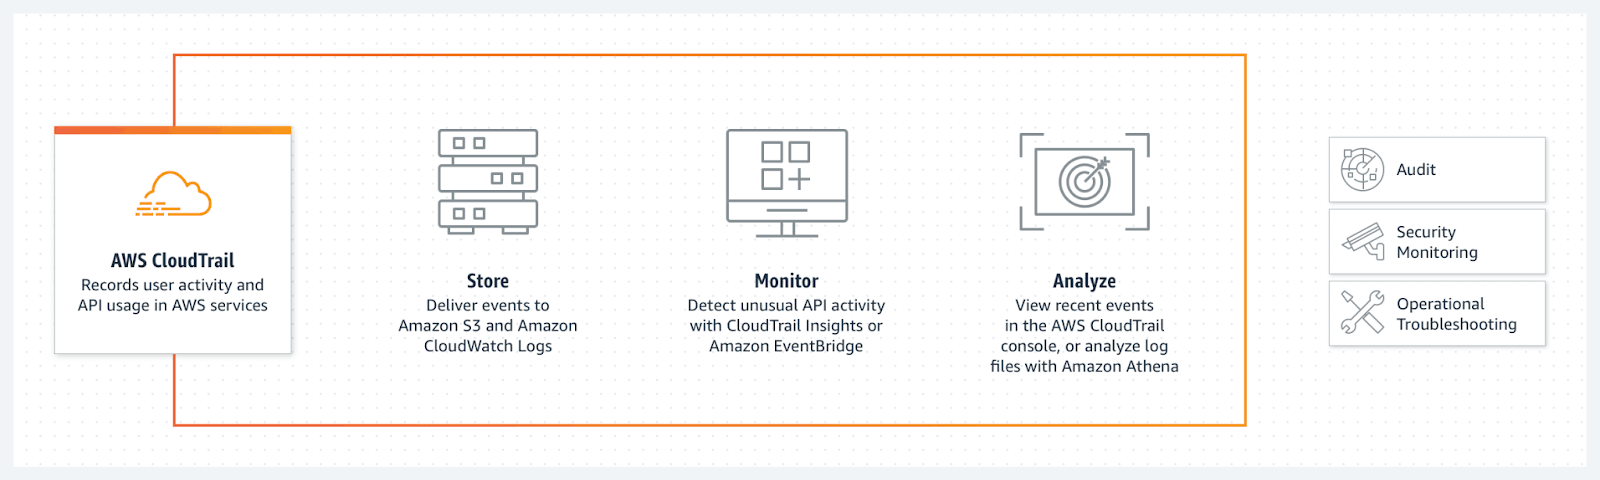
Amazon CloudTrail collects records of user activity and API calls to AWS services.
Even with both of these tools in play, you may still face some of these common AWS monitoring challenges.
Watch this quick demo to see how ChaosSearch can help:
Read: Going Beyond CloudWatch: 5 Steps to Better Log Analytics & Analysis
2. Put raw log data in an AWS S3 data lake
The first step to effective log analysis is setting up your AWS data lake the right way. Configure it to ingest and store raw data in its source format – before any cleaning, processing, or data transformation takes place.
Storing data in its raw format gives you the opportunity to interrogate your data and generate new use cases for enterprise data. The scalability and cost-effectiveness of Amazon S3 data storage means that you can retain your data in the cloud for long periods of time, and query it months, or even years down the road.
When your data lake stores logs in its raw format, it also means that nothing is lost. As a result, your AWS data lake becomes the single source of truth for all the raw data you ingest.
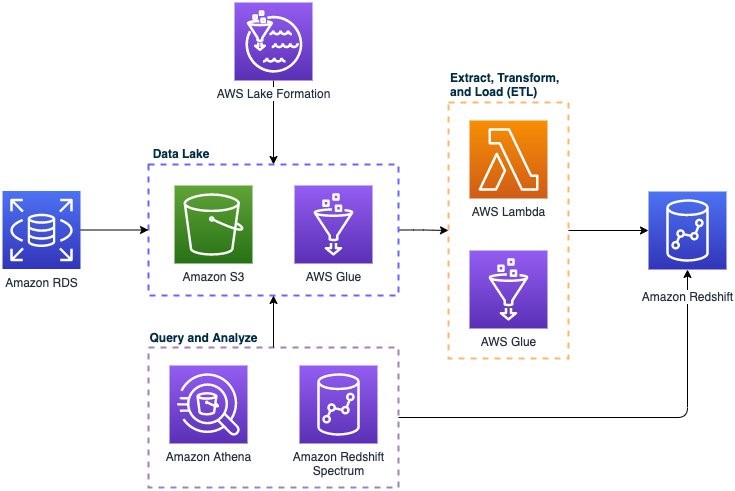
Architectural diagram for a foundational enterprise data lake. AWS customers can deploy and manage the solution themselves, or with support from AWS managed services.
One thing to note: Amazon S3 offers different classes of cloud storage, each one cost-optimized for a specific access frequency or use case. Generally speaking, Amazon S3 Standard is a solid option for your data ingest bucket, where you’ll be sending raw structured and unstructured data from both your cloud and on-prem applications.

3. Consider longer data retention windows for more effective analysis
Data retention policies establish how long your log data will be retained in the index before it is automatically expired and deleted. These policies also determine how much historic log data will be available for analysis at any given time. So, a data retention period of 90 days means that developers and security teams will have access to a rolling 90-day window of indexed log data for analysis.
Shorter data retention windows result in lower data storage costs, but the trade-off is that you quickly lose access to analyze older log data that could support long-term log analytics use cases ranging from advanced persistent threat detection to incident investigation, long-term user trends, root cause analysis, among others. On the other hand, retaining log data for longer provides deeper access to retrospective log data and better support for long-term log analytics use cases. If you’re using tools like CloudWatch or the ELK stack – costs and performance can degrade as log data volume increases. So many people delete data they otherwise need for analysis.
That doesn’t have to be the case. Gaining total observability of your network security posture and application performance requires a centralized log management solution that enforces a small storage footprint for your logs and supports security operations, DevOps, and CloudOps use cases.
4. Avoid general-purpose observability solutions
Many companies address their observability needs of full, centralized visibility into metrics, logs and traces by buying a holistic application performance management (APM) solution from one vendor, such as DataDog.
However, if you do that, you may find that while centralizing all telemetry in a single platform works well at first, it creates significant challenges at scale. The underlying data technologies for monitoring, troubleshooting and trend analysis/reporting are fundamentally different, often leading to ballooning costs, reduced data retention, increased operational burden and limited ability to answer relevant analytics questions.
To avoid these challenges and reduce DataDog costs, a better approach may be to build a best-of-breed observability solution made up of open source tools and open APIs. The Cloud Native Computing Foundation (CNCF) provides a good basis from which to start with its OpenTelemetry project. This open-source project is a collection of tools, APIs, and SDKs you can use to instrument, generate, collect, and export telemetry data (metrics, logs, and traces) to help you analyze your applications’ performance and behavior.
So, instead of relying on a single tool to explore all telemetry, a cloud-native observability stack might look something like this.
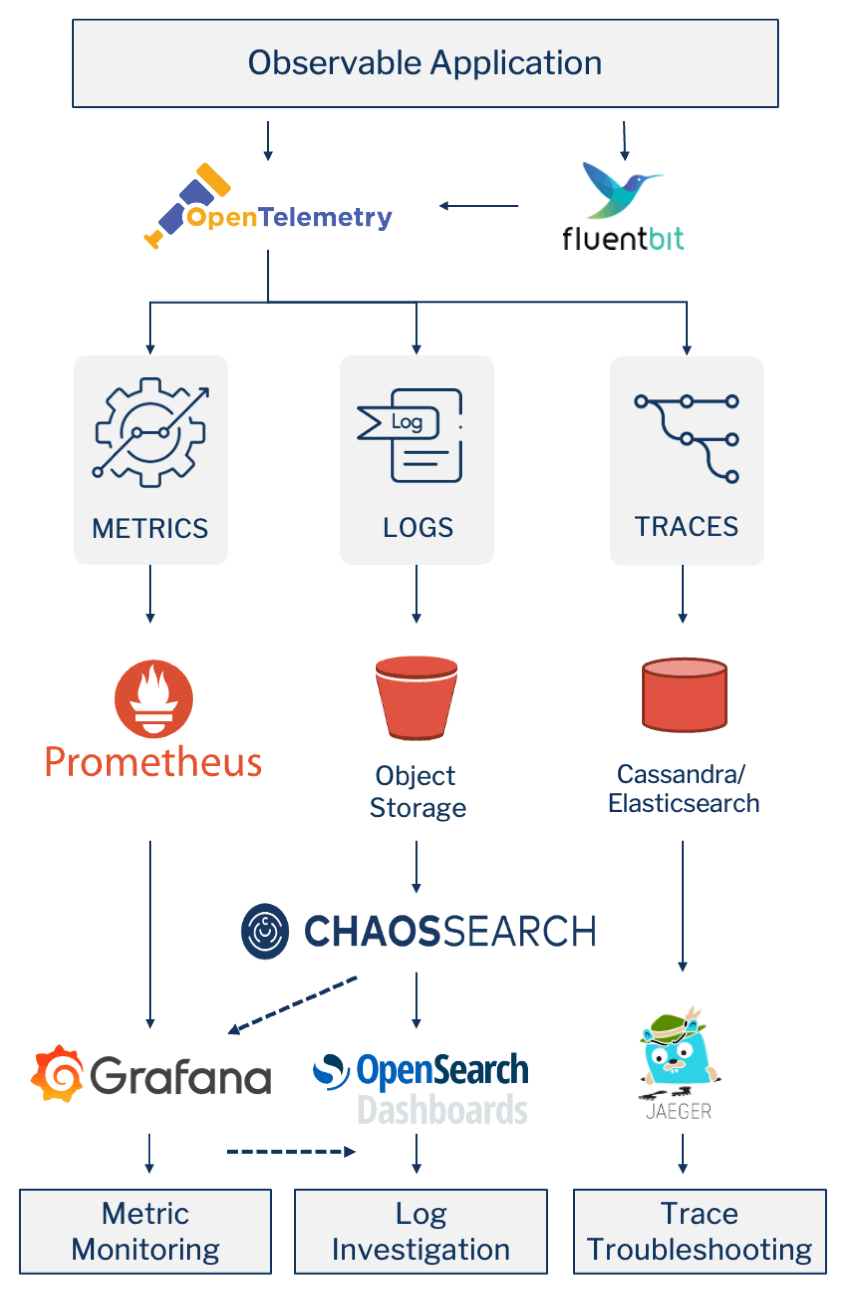
Source: Building a Cost-Effective Full Observability Solution Around Open APIs and CNCF Projects
5. Collect and analyze all log data centrally
As mentioned above, many companies have a multi-cloud or hybrid cloud strategy that makes log analysis in CloudWatch difficult to manage. Even if all of your workloads run in AWS, you may not be able to collect and analyze as much data from them as you would prefer, since CloudWatch only supports specific predefined log and metrics types.
To extend your log analytics strategy beyond CloudWatch, deploy a logging solution like ChaosSearch that gives more control over the log and metrics data you expose, as well as how you interact with it. There are typically two ways to do this:
- You can use CloudWatch with ChaosSearch by exporting CloudWatch logs, moving them to an Amazon S3 bucket and indexing these logs and other log data stored in S3 using ChaosSearch
- You can bypass the AWS CloudWatch log process and push logs directly into Amazon S3. From there, the platform can index any data stored in S3 in the log, JSON, or CSV format. There is a huge ecosystem of log shippers and tools to move data into cloud object storage, including Logstash and beats, Fluentd, Fluentbit to Vector, Segment.io, Cribl.io, or programmatically from Boto3. You can use AWS EventBridge for Observability by configuring the service to collect event data from applications or services and route the data into S3 buckets for indexing using ChaosSearch.
Making the most of your AWS logs
To sum up, it’s tempting to go for the default AWS tools like CloudWatch and CloudTrail to manage your log data, but they may not be enough – particularly if you have a complex serverless or microservices-based architecture, or if you are operating in a multi-cloud or hybrid cloud environment.
- Understand Differences between CloudWatch and CloudTrail: Understand the features, benefits, and limitations of Amazon’s two cloud-native services for logging and monitoring.
- Ingest and Store Raw Log Data in AWS S3 as a Data Lake: Transform your Amazon S3 into a hot data lake for log analytics and store log data in its raw source format to support diverse analytics applications.
- Avoid Data Retention Trade-offs: Implement a centralized log management solution with a small storage footprint to reduce analytics costs and prevent data retention trade-offs.
- Build a Best-of-Breed Observability Stack: Don’t rely on one solution for observability. Create a best-of-breed observability by choosing the best solutions for metric monitoring, log investigation, and trace troubleshooting.
- Collect and Analyze Log Data Centrally: Deploy a logging solution like ChaosSearch that lets you centralize your log data (including CloudWatch logs) in cloud object storage and analyze everything together.
There are many reasons why this is true – from scalability and usability issues, to cost. To make the most of your logs and reduce AWS log costs, ideally you should centralize them (along with log files from other sources) using AWS S3 as a data lake. From there, you can rely on a best-of-breed observability approach to understand all of your telemetry – including logs, metrics, and traces.


