

The success of businesses like Zoom, DropBox, and Slack demonstrates the power of product-led growth (PLG) as a strategy for scaling software companies in 2023. Central to this approach is event analytics, the practice of analyzing event data from a software product to unlock data-driven insights. Companies following a PLG strategy (“PLG companies”) use this data to inform product development decisions to enhance user experiences and drive revenue.
In this blog, we’re taking a closer look at the key characteristics of product-led growth, how event analytics works for PLG companies, and the six types of event data their product teams use to uncover insights and accelerate growth.

What is Product-led Growth?
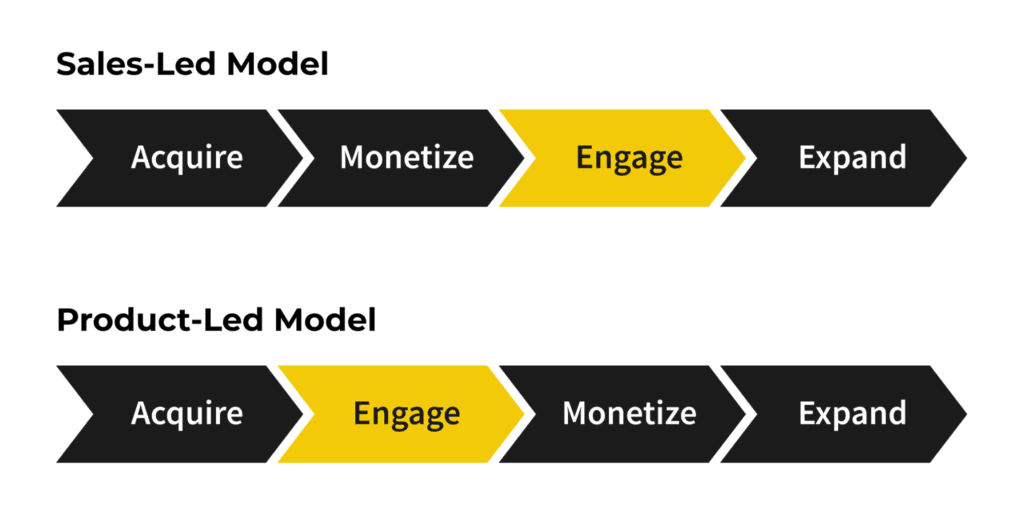
Product-led growth is a business growth strategy for software companies that focuses on leveraging the product itself as the primary driver of customer acquisition, activation, expansion, and retention.
PLG companies are less dependent on traditional marketing and sales tactics - instead, they emphasize the product's value, features, and user experience as key drivers for attracting and retaining customers.
Characteristic growth strategies for product-led companies include:
- Self-Serve Product Experience - PLG companies try to design products that are intuitive and easy to use. This makes it easy for prospective customers to start using and getting value from the product without any need for training.
- Self-Serve Sales Model - PLG companies often implement a self-serve sales model where users can independently upgrade their service without interacting with a salesperson.
- Freemium Pricing Strategy - Many PLG companies follow a freemium pricing model, offering a free version of their product with limited features and one or more paid versions with additional features and capabilities.
- Viral Marketing and Network Effects - PLG companies can often generate growth through viral marketing and network effects when satisfied users recommend their products to friends and colleagues. This is especially valuable for software products with a social component (e.g. document sharing, calendar/scheduling, business collaboration, video conferencing, etc.).
- Customer-Centric Approach - For product teams following a PLG strategy, delivering frictionless value to customers is the key to driving business growth. Product teams focus on understanding user needs and making it easy for users to experience value.
- Data-Driven Product Optimization - PLG companies can use in-app event tracking to capture user behavior and product usage data throughout the user journey. This data can be analyzed to better understand customer pain points and application issues, then make data-driven product improvements to increase revenue and enhance user experiences.
Event Analytics for PLG: How it Works
Event analytics is the practice of analyzing event data from a software product to better understand user interactions with your product and optimize the customer journey.
As a starting point for event analytics, product teams must implement event tracking in their products and choose which default or custom events should be tracked.
Event tracking can be used to capture and document all kinds of user actions that occur throughout the customer journey, including things like:
- Creating a new account,
- Opening the app,
- Logging in or out of the app,
- Changing a subscription plan,
- Engaging with product features,
- Viewing a specific page,
- Making a purchase, or
- Referring a friend to use the product.
In addition to database transactions and user interactions, event tracking can also be used to track application performance issues like software bugs, timeouts, crashes, and unexpected errors.
Event data is captured in the form of machine-generated event logs, which are automatically written each time a tracked event takes place inside the product.
As these logs are created, product teams employ a variety of applications and services to:
- Collect and aggregate the event data,
- Ship the event data to a centralized storage location (e.g. a data warehouse or data lake),
- Clean, prepare and transform the data in different ways to enable analysis, and
- Analyze the data to gain a deeper understanding of how users are interacting with the product.

Read: What is DataOps? Leveraging Telemetry Data for Product-Led Growth to discover how PLG companies are implementing DataOps teams to accelerate insight development from event log data and drive continuous product improvements.
Accelerating Product-led Growth with Event Analytics
Using event analytics for PLG allows teams to gain a deeper understanding of the customer experience and uncover data-backed opportunities to implement new features and updates that enhance revenue.
By aggregating and analyzing event data for PLG from the customer journey, product teams can answer questions like:
- How are users engaging with the product?
- Which product features are the most popular?
- Where are users encountering friction or bottlenecks?
- What user actions are correlated with customer churn events?
Understanding the answers to these and other questions about user experience helps product teams determine which features to build next, how to reduce friction in the customer journey, or what changes to the product interface could make it faster and easier for users to accomplish their goals.
Six Types of Event Data for PLG and How to Use Them
Now we'll take a closer look at six different types of event data for PLG and how product teams can analyze them to uncover insights that inform data-driven product improvements and drive revenue growth.
1. Customer Acquisition Data
Customer acquisition is the process of attracting potential customers to start using the product. For PLG companies, customer acquisition is driven by organic sign-ups, user adoption through self-service channels like free trials or freemium subscriptions, and referral marketing.
As part of an event analytics initiative, PLG companies can track customer acquisition events like:
- When a user downloads or accesses the app for the first time,
- When a user registers a free account,
- When a user confirms their account registration via email, phone, or SMS, or
- When a user logs into the app for the first time.
Product and market teams can do funnel analysis on customer acquisition events data to identify the greatest drop-off points and sources of friction in the customer acquisition process and implement changes to drive more free trials or sign-ups.
2. Customer Activation Data
Customer activation is the process of converting free trial users into paying customers by helping them derive value from the product as quickly as possible after signing up. PLG companies with event analytics capabilities can track a number of events related to customer activation, including things like:
- When a user logs into the app as a returning user,
- When a user engages with a product feature for the first time,
- When a user engages with onboarding resources or other guides to help them use the product, or
- When a user converts from a free trial to a paid subscription.
Analyzing data from customer activation events can help product teams identify the most common pain points and bottlenecks customers experience as they attempt to get value from using the product. By understanding these challenges, product teams can design and offer new onboarding materials and other resources to help customers get started and increase customer activation.
3. Customer Engagement Data
For product-led companies, user engagement is a key predictor of customer retention. If a customer is consistently using the product and getting value from it, they’re more likely to continue with a paid subscription. If the customer’s product usage slows down, they’re more likely to cancel.
PLG companies can develop insights into customer engagement and retention by tracking events like:
- Total logins or number of times the app was accessed in a given time period,
- Weekly, monthly, or total time spent in the product,
- Frequency of engagement with specific product features, and
- When a user churns or cancels their subscription.
Product teams can analyze customer engagement data to understand the behavioral differences between a healthy customer and one who may be close to churning. They can even build predictive models to anticipate when a customer is about to churn and offer support or incentives to try and retain the customer.
4. Customer Expansion Data
Customer expansion is the process of increasing revenue from existing customers by upselling additional features, offering premium plans or add-ons, and encouraging customers to upgrade their service to a more expensive plan with additional benefits.
PLG customers can keep an eye on customer expansion by tracking events like:
- When a user increases their usage of the product or specific product features,
- When a user upgrades from a paid subscription plan to a more expensive package,
- When a customer upgrades their subscription to allow for more users within their organization, or
- When a user purchases additional services not covered by their subscription.
By analyzing customer expansion data with event analytics, product teams can understand key drivers for customer expansion and even start to predict which users will benefit most from upgrading their service. Armed with this information, product and sales teams can collaborate to implement low-touch or self-service strategies designed to streamline and accelerate customer expansion.
5. Customer Referral Data
A referral happens when existing customers recommend a product to their friends or colleagues, resulting in new user acquisitions and opportunities to activate and retain those customers. Product-led companies can track customer referral events to better understand their impact on revenue including events like:
- When an existing user invites one or more friends to use the product with them,
- When a new user registers an account after clicking on a friend’s referral link,
- When a new user registers an account after clicking on an affiliate link, or
- When an existing customer shares a link to the product on social media using an in-app sharing link.
Tracking and analyzing customer referral events can help product teams measure the impact of user referrals as a growth driver, identify the most effective strategies for generating referrals, and introduce new product features, promotions, or UI elements to further encourage and increase customer referrals.
6. Customer Firmographic Data
Customer firmographic data is another type of customer data that can be useful for companies following a product-led growth strategy. Correlating event data with customer firmographic data allows product teams and market teams to segment users in different ways, understand how different types of users are engaging with the product, and construct ideal customer profiles (ICPs).
By understanding which types of firms or customers are benefiting most from the product, PLG companies can refine their customer acquisition, activation, and expansion strategies to better target prospective customers with the highest predicted value for the business.
Streamline Event Analytics for PLG with ChaosSearch
ChaosSearch enables product-led growth companies to deploy a best-of-breed observability approach, which delivers event analytics at scale, deeper insights into user behavior, optimized custom acquisition, activation, and retention, and data-driven decisions to drive business growth.
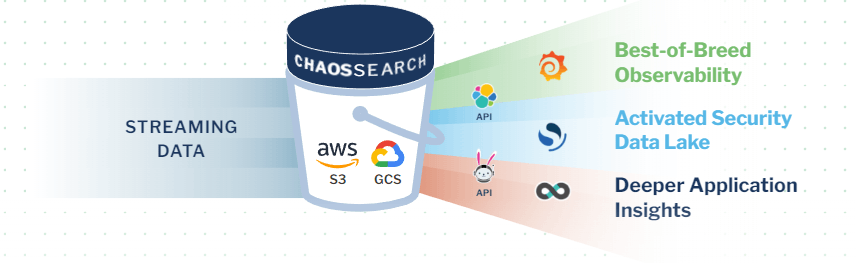
ChaosSearch attaches directly to Amazon S3 & Google Cloud Services, allowing product teams to transform their cloud object storage into a scalable, durable, and cost-effective event data lake. As users engage with the product and event data is generated, product teams have only to ship the logs to S3 or GCP in their raw format. Once those valuable event logs land in S3 or GCP, our proprietary Chaos Index® technology automatically indexes the data for full-text search or relational querying with up to 95% data compression.
From there, product teams can use our sophisticated Chaos Refinery® tool to apply virtual transformations to the data with no data movement, duplication, or changes to the underlying representation. Once those transformations have been applied, ChaosSearch users can visualize the data and create dashboards with our built-in Kibana tool to gain deeper application insights that can help drive product-led growth and revenue generation.

Ready to learn more?
Read our free-to-access white paper How a Data Lake Platform Scales Log Analytics and Fulfills the Data Lake Promise to learn more about how ChaosSearch can deliver event analytics at scale and support your product-led growth strategy.

