5 Guiding Principles of Digital Business Observability
Modern data-driven organizations are synergizing operations observability, business intelligence, and data science with digital business observability programs that break down data silos, increase productivity, and drive innovation.
Digital business observability combines IT and business data with cutting-edge data science techniques, enabling deeper analysis and unlocking valuable insights that propel innovation across use cases from sales and marketing to product design and financial operations.
Digital Business Observability: Analyzing IT and Business Data Together was developed by Kevin Petrie, VP of Research at Eckerson Group with sponsorship from ChaosSearch to help enterprises better understand digital business observability programs.
Keep reading our report summary to discover the adoption drivers, challenges, requirements, benefits, and use cases of business observability.

What is Digital Business Observability?
Digital business observability is a data initiative blending three programs that already exist in most enterprises: operations observability, business intelligence, and data science.
- Operations Observability is an IT organization’s ability to understand the behavior, health, and performance of operational IT systems in real-time by collecting and analyzing telemetry data (logs, metrics, and traces) from those systems.
- Business Intelligence is a set of capabilities for collecting, analyzing, and extracting actionable insights from business data to help the organization make data-driven and informed decisions.
- Data Science is the use of statistics, advanced analytics tools and algorithms, technologies like machine learning and AI, and scientific computing to extract meaningful insights from data and enable a data-driven approach to making key business decisions.
A digital business observability platform integrates telemetry data from IT systems with relational data from BI systems to break down data silos and enable new analytics use cases, help both IT and the business solve problems and achieve their goals.
Digital Business Observability vs. Monitoring - What’s the Difference?
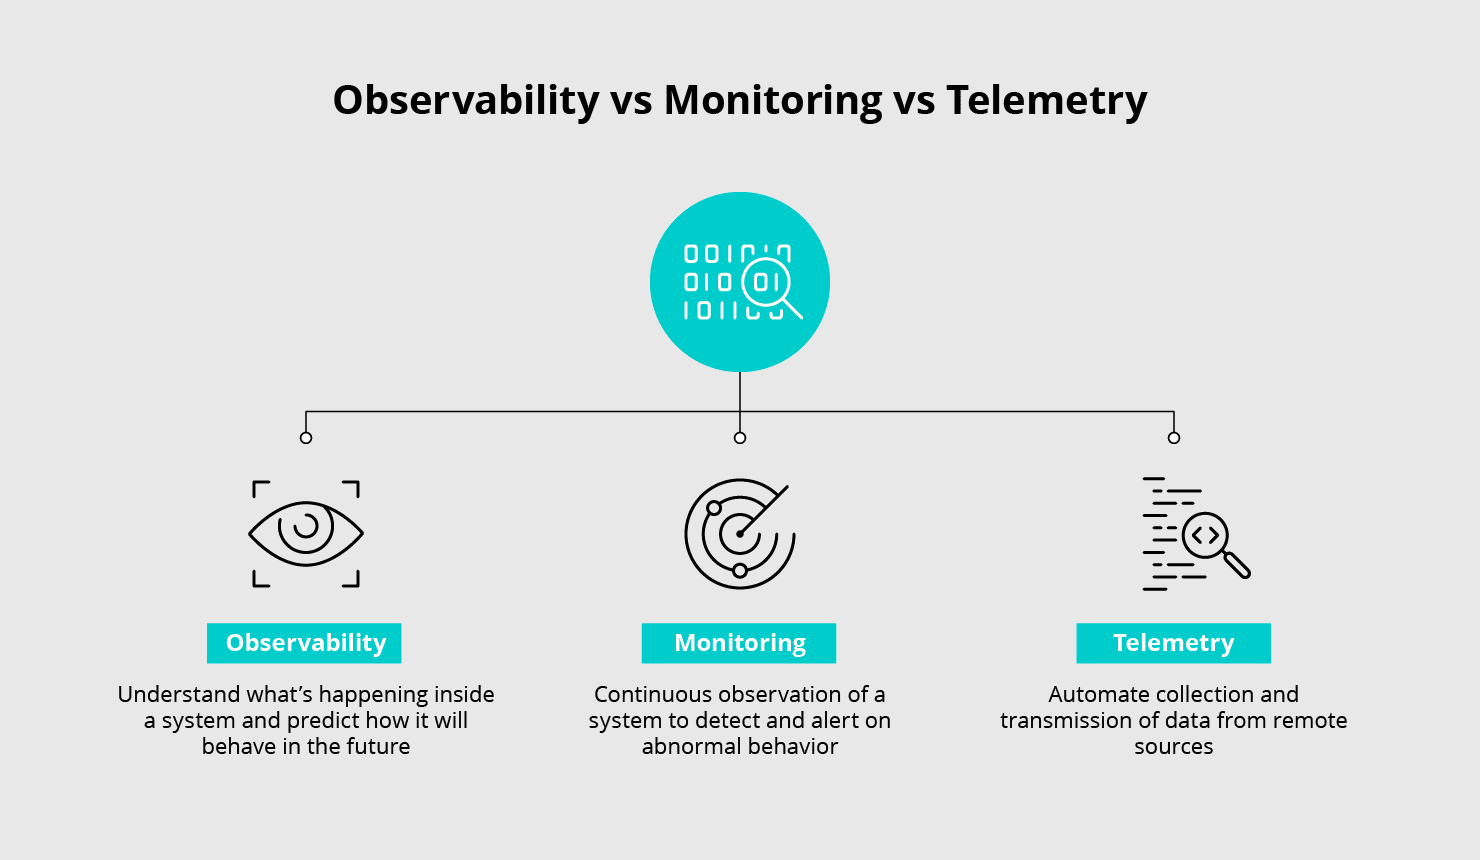
Digital business observability and monitoring (e.g. continuous monitoring, application performance monitoring (APM), network monitoring, infrastructure monitoring, etc.) are software-based capabilities that give enterprise IT organizations visibility into the health, behavior, and performance of IT systems.
However, digital business observability and monitoring are not the same thing and it’s important for enterprise IT organizations to recognize the difference.
Monitoring an IT system (e.g. an application or network component) involves tracking predefined system health metrics or key performance indicators (KPIs) in real time, collecting and aggregating the results, and visualizing those results for consumption by DevOps or IT personnel. Once the data is visualized, dashboards can be reviewed or analyzed to uncover potential issues with application/network security or performance.

In contrast, the digital business observability process involves collecting a wider range of telemetry data about an IT system’s internal state and behavior, aggregating that data alongside business data, and enabling business analysts, data scientists, or IT personnel to explore the data with advanced analytics software.
Monitoring programs help IT personnel understand how application health and performance is changing, but digital business observability helps IT personnel dig deeper into their data to better understand how and why those changes are happening.
5 Honest Truths of Digital Business Observability
1. Digital Business Observability Helps Close the IT-Business Gap
Operations observability focuses on collecting and analyzing data from IT systems, but siloed data, tools, and technology can prevent operations observability programs from generating valuable insights that drive business decision-making and innovation.
Digital business observability can create a significant business impact by breaking down these data and technology silos with analytics platforms that allow data scientists to analyze telemetry data from applications and network infrastructure alongside relational data from business systems. This capability can create alignment and promote collaboration between IT and the business.
Read: How to Use ChaosSearch with Grafana for Observability
2. Multimodal Analytics Powers Business Observability Programs
The key capability that powers business observability programs is multimodal analytics - the ability to seamlessly apply all three analytical modes to IT and business data:
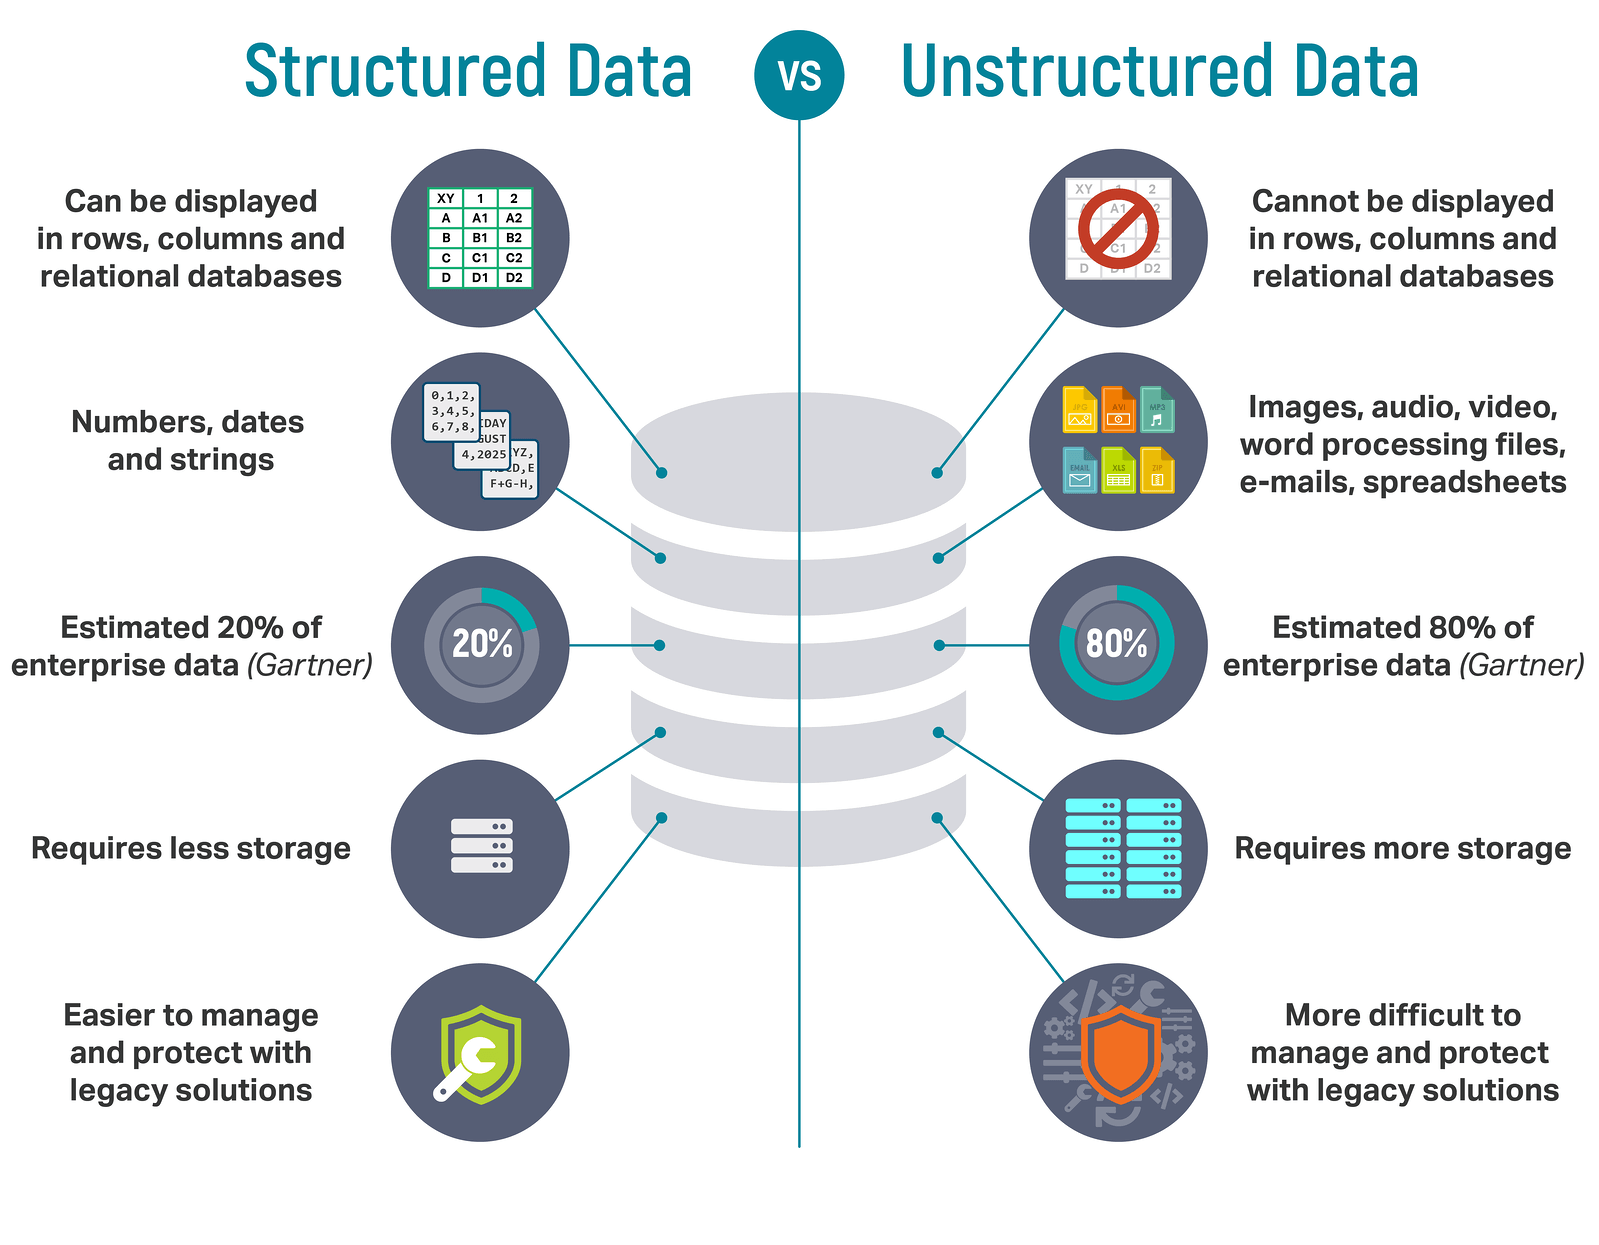
- Search. IT and SecOps teams use software tools like Elasticsearch to index and search unstructured data, including the telemetry data (logs, metrics, traces) that supports operational observability programs.
- Query. Data scientists and analysts on the business side use structured query language (SQL) to query records within databases.
- Model. Data scientists (and a growing number of other users) can use machine learning models to search for patterns across structured and unstructured datasets, sort and classify the data, or to enable predictive analytics.
Combining IT and business data with multimodal analytics unlocks powerful new use cases and massive value potential, enabling both business and IT users to leverage data in new ways to make smarter decisions and drive value.
3. Digital Business Observability Enables Diverse Use Cases
There are five use cases where enterprises can combine IT and business data with multimodal analytics capabilities to drive cross-functional initiatives. These use cases for business observability include:
- Marketing. Operational observability captures user behavior data via clickstream logs and website UX metrics, while analysts on the business side are databasing transaction records, survey results, and customer service tickets.
Integrating marketing data from both IT systems and the business helps create a holistic view of customer and prospect engagement across platforms, giving marketers the insights they need to build maximally effective campaigns. - Sales. ITOps engineers have access to data that describes the online behavior of users, including existing leads and customers. Sales operations teams have access to customer data in CRM. A digital business observability program that allows sales managers to correlate user behavior with CRM data can help organizations build more compelling and effective sales campaigns.
- Customer Service. ITOps engineers can use log and metric analytics to understand how customers are engaging on the organization’s digital platforms, including events that negatively impact the customer experience. On the business side, CX feedback comes from trends in customer purchasing, service tickets, and survey responses that are tracked in a BI database.
A digital business observability program could integrate customer experience data from these two (usually siloed) sources and analyze it to measure customer satisfaction, predict churn, and support a strategic approach to customer retention. - Product Design. Product teams can use digital business observability to build more satisfying digital experiences for customers. For example, a website designer might work with ITOps to analyze traffic and clickstream data, then use that feedback to improve navigation paths, introduce new website features, or optimize the customer journey.
- Financial Operations. Digital business observability can bring together budget guidelines from financial managers, cloud performance/utilization metrics from ITOps, and spending proposals from product teams. Analyzing this information together can help organizations improve resource allocation, reduce cloud infrastructure costs, and achieve organizational targets while staying on budget.
4. Successful Digital Business Observability Initiatives Depend on People, Processes, and Technology
Despite the importance of technologies like multimodal analytics and scalable cloud infrastructure, a digital business observability program also depends on people and processes for its success. To increase the odds of success for your digital business observability program, consider the following:
- Assemble a cross-functional dream team. Digital business observability programs require involvement from colleagues in multiple departments to succeed. ITOps and CloudOps engineers, data analysts, data scientists, department leaders (e.g. from marketing, sales, customer service, product, finance, etc.), and an executive sponsor should all be included in the implementation team.
- Define business use cases. Interview team members to identify opportunities where IT and business data should be integrated. Create a list of potential use cases and prioritize them based on feasibility and cost/benefit.
- Research new architectural approaches. Technological requirements for a successful digital business observability program include scalable data storage, high-efficiency data processing, and multimodal analytics capabilities. Your team may need to find a new tool that enables multimodal analytics on multi-structured IT and business data.
Read: How to Use Cribl Stream and ChaosSearch for Next-Gen Observability
5. True Digital Business Observability Means Meeting Essential Requirements
There are three key challenges that digital business observability programs will need to overcome in the enterprise environment: varied skill-sets between IT and business users, siloed tools and technologies (ITOps tools vs BI tools) that are not designed for multifaceted workloads, and exploding data volumes.
Three essential requirements are identified for a digital business observability program that can overcome these challenges:
- Scalability. Enterprises need scalable, cost-effective data storage to support long-term analytics use cases by efficiently retaining large volumes of structured and unstructured data.
- Processing Efficiency. Enterprises need efficient and cost-effective methods of transforming, indexing, and analyzing large amounts of data.
- Multimodal Analytics. A digital business observability program deals with both structured and unstructured data in a variety of formats and must support diverse analytical use cases. IT and business users need shared tools that can easily switch between three analytical modes: searching, querying, and modeling.

Enterprise data includes both structured and unstructured data in a variety of formats. That’s why digital business observability programs need multimodal analytics, the capability to search, query, or model data as needed to extract insights.
Enable Digital Business Observability with ChaosSearch
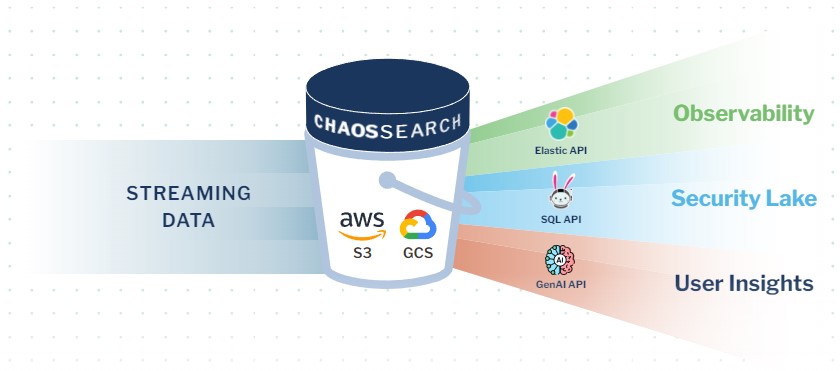
Chaos LakeDB is the first and only multimodal data lake database with built-in support for full-text search, SQL querying, and generative artificial intelligence (GenAI) analytics.

ChaosSearch is a SaaS data platform that deploys proprietary high-compression data indexing technology on top of cost-effective public cloud storage (ie. AWS S3 and GCP), rendering our customer’s data fully searchable and enabling data analytics with existing BI tools via open APIs.
Our platform brings IT and business data together, breaking down silos and delivering multimodal capabilities (search, query, and model) that unlock new cloud-native observability and security operations use cases, as well as deeper application insights.
Want More Digital Business Observability Insights?
Read the Eckerson Group’s Digital Business Observability report, sponsored by ChaosSearch. Learn the following:
- Strategic adoption drivers for digital business observability programs in 2023,
- Key benefits of digital business observability programs,
- The impact of IT and Business domains on planning and designing digital business observability programs,
- And more…
To get full access and all the insights, download the full report:


